The 90 Percent Problem: Why Lean Treasury Teams Never Get to Strategy
Stacy Lassiter, who leads finance and treasury for Mobile County, Alabama, estimates he spends “probably 90% of [the] day tracking, measuring, and managing” to land on an end-of-day cash position. He does most of that work by hand: recording every deposit, recording every disbursement, then manually calculating where the day lands and what he projects for tomorrow.
That end-of-day cash position is the operational floor that strategic treasury work stands on. It comes due every morning. Until it’s done, forecasting, liquidity analysis, and decisions about idle balances are all pushed into whatever time is left.
Lassiter’s situation is common among government treasury leaders. When Monetary’s Luke Otto polled finance professionals on the biggest barrier to advancing the treasury function, over 40% said their teams are stretched too thin. Retirements are thinning the bench further, so for most of those teams relief won’t arrive as headcount. And where it does, the new hire inherits the same manual routine.
On lean treasury teams, capacity for strategy isn’t found or hired. It needs to be manufactured by automating the operational base first. Here’s where the 90% actually goes, why headcount can’t recover it, and what the workday looks like when the cash position builds itself.
The 90 Percent Problem, Defined
Cash management is the operational job. Forecasting and analysis are the higher-value ones. On a small team, both land on the same desk, so the operational half consumes the day and the planning work waits.
The daily work wins because it’s time-sensitive. “You can’t wait until time goes forward. You gotta manage the business on a day-to-day basis,” Lassiter says. A forecast can slip a week without anyone noticing. A missed disbursement can’t.
The strategic work, when it happens, falls to a handful of people. “It’s mostly me and the other department heads coming together and putting this stuff together,” Lassiter says. “Everyone else is pretty much transactional.”
The root problem described by Lassiter isn’t fixable through discipline or limited headcount. Operational and planning work sit on the same desk, and the urgent half sets the schedule. How that work is completed is the part you can change.
The Manual Work Behind a Daily Cash Position
Every day, someone assembles the cash position by hand across every bank, account, and fund. Nothing strategic starts until that number exists. The routine looks like this:
- Log into each bank and pull the day’s bank balances
- Record every deposit and disbursement, the cash inflows and outflows, by fund
- Run the daily bank reconciliation so the bank data ties out against the books
- Calculate where the position lands, then project tomorrow
“We’re just manually looking at everything that’s done in a given day, recording all deposits, recording all disbursements, and manually calculating what our end-of-day cash flow is and what we project for the next day,” Lassiter says.
Government cash carries inflows most corporate teams never handle, including tax receipts, grant revenue, and bond proceeds. Outflows span debt service, payroll, and vendor payments, all tracked by fund and stitched together in spreadsheets. A separate finding from a poll in the same session supports this: over 40% said they produce a daily position, but only by compiling it manually.
Daily cash positioning is the floor everything strategic stands on. Until the position is known, there’s nothing to forecast from and no liquidity picture to act on. “If you don’t measure it, you can’t manage it,” Lassiter says.
Why a New Hire Inherits the Same Problem
Nearly a third of all public finance workers are approaching retirement age, according to the Government Finance Officers Association (GFOA) and the analytics firm Lightcast. The people who know how your systems work are retiring faster than they’re being replaced, and the labor market you’d hire from is shrinking too.
“Bench depth is what’s lacking,” explains GFOA’s Mike Mucha, “it’s not necessarily that local governments are struggling to replace the CFO.” On a two-person treasury team, there’s no one on the bench to sub in.
Hiring, where you can do it, still helps. But whoever you add starts the morning the same way you do, logging into bank portals, pulling balances, rebuilding the day’s position by hand. A new hire doesn’t change the process, they inherit the manual one that isn’t working.
Automate the Manual Work Before You Build the Strategy
Discipline alone won’t create more capacity for treasury teams, because the daily close reclaims the time. And you can’t reliably hire your way to it, because the new person inherits the same manual cash-positioning work.
That leaves automation. This is the pattern Otto hears constantly: “We have a lot of day-to-day operations, and I hear that all the time. We gotta keep the lights on. We gotta make sure everything is functioning, and then we’ll get to the strategic stuff.”
But there is never time for tactical work because keeping the lights on is a full-time job when the lights are wired by hand. And when Otto asked his audience to name the single biggest barrier to advancing the treasury function, capacity took the largest share of the vote. The solution: automate the operational base first, recover the hours it was taking, and build strategic capacity on what’s left. Reverse the order, and the base stays manual while the purposeful planning hours get pulled straight back into operations.
The same pattern shows up outside government. In AFP’s 2025 Treasury Benchmarking Survey, automating manual processes ranked as the second most challenging task treasury faces, cited by 57% of respondents. The task that ranked first, at 62%, was cash and liquidity forecasting, which is the organizational work that never gets started.
“Hire more people” treats capacity as a headcount problem, when automating the base manual work treats it as the process problem it actually is.
What Automating the Daily Cash Position Looks Like
Automating the base means the bank data flows in on its own and the day’s position is waiting for you. That’s the version of the job Lassiter wants. “I really want to be in a position where I can push a button in the ERP system and get what a fund balance is in the book system and get what that same fund balance is in the bank system,” he says.
Automating the daily cash position involves four steps.
- Connect your banks: Monetary Cash Management pulls balances and transactions straight from your banks through a secure API, so the data arrives without manual entry. This depends on bank connectivity. Large banks connect cleanly. A small community bank with no API still means a portal login. The first setup runs through your IT and banking-relationship approvals before any data flows.
- Build the categorization rules once: The system then sorts transactions by purpose on its own, turning daily cash-flow analysis into a few clicks.
- Open to a position that’s already there: Because the data flows in and sorts itself, the day’s cash position is ready in a few clicks rather than hours of spreadsheet work.
- Get told when a balance drifts: Set a threshold per account, and the system flags any balance that drops below it, so monitoring liquidity stops meaning a login to every account.
Each step removes a piece of the manual base, including portal logins, transaction sorting, end-of-day math, and account-by-account balance checks described earlier. What’s left is real-time visibility into the same position the team used to spend all morning building.
What the Reclaimed Time Lets You Do
Automating the base work creates time for the forecasting, analysis, and the cash decisions the team never had time to make. Lassiter’s own goal is a rolling 13-week cash flow. Built on automated data, that forecast gets maintained as new information lands instead of rebuilt from a blank spreadsheet each quarter.
Here’s where the recovered hours actually land:
- Faster response when intergovernmental cash moves: A delayed grant still arrives late, but the forecast is quicker to correct once it does.
- Idle cash put to work: With a reliable forecast, balances can move into short-term investments inside the bounds your investment policy already sets. Without that visibility, staying conservative was the only safe option.
- Balances sized to the right horizon: Government cash splits across three tiers (daily liquidity, short-term investments, and long-term investments) and sizing each one depends on knowing what’s available and for how long. Mobile County has already taken the version of that decision it can make without a forecast, reviewing its accounts for what they were earning and substantially raising the return on short-term investments. The tier above that, moving money out further with confidence, is what a working forecast unlocks.
This is the cash flow forecasting GFOA recommends, both to keep enough liquidity on hand and to limit idle cash earning nothing.
Strategy Work is Not Optional
The 90 percent problem is a sequencing problem, and that is the one variable a lean team fully controls. Automate the manual base first, and the same one or two people become the strategic function the organization already needs. In Mobile County terms, the cash position stops being a day-long manual build and is simply there each morning. The day opens on forecasting instead of data entry.
This week, time the single most manual step in your daily cash position, whether that’s pulling balances or categorizing transactions. The hours you win back when it disappears will show you the kind of strategic-capacity budget that’s possible through automation, and the number is almost always larger than you expect.
That capacity potential, not a job posting, is where strategic treasury actually starts.
When you’re ready to see it on your own accounts, schedule a demo of Monetary.
Related Cash Management Reading
Disclaimer: Monetary does not provide professional services or advice. Monetary has prepared these materials for general informational and educational purposes, which means we have not tailored the information to your specific circumstances. Please consult your professional advisors before taking action based on any information in these materials. Any use of this information is solely at your own risk.
A Cash Forecast Is Not a Budget, and Stale Numbers Prove It
Most treasury teams at governments and nonprofits use a cash flow forecast to manage future cash balances. Far fewer have checked that forecast against what actually moves in and out of the bank.
When a reimbursement lands late or a capital project slips, it affects the organization’s cash flow. But if those changes aren’t caught and reflected in the forecast, cash flow projections will continue as if nothing happened. The number stops reflecting reality before anyone notices.
Those oversights can have material consequences for any organization. When you make financial decisions based on a forecast that nobody reconciles, the result is yield you didn’t actually earn, borrowing you didn’t need, and cash shortfalls you didn’t see coming.
That’s why a stale forecast can be worse than having no forecast at all: It carries the authority of a hard number without the accuracy.
Stacy Lassiter leads finance and treasury for Mobile County, Alabama, after 40 years in the private sector closing books by the fifth business day of every month with full variance analysis. The report he gives county commissioners today is a single backward-looking snapshot of last quarter’s cash by fund, with no forward-looking forecast attached.
If that gap exists for someone with his discipline, it exists for a lot of teams.
This article covers what separates a cash forecast from a budget, how forecasts grow stale without regular review, and the simple fix treasury teams can make to keep their forecasts honest.
What makes a cash forecast different from a budget?
Cash flow forecasting is the process of predicting an organization’s future cash inflows and outflows to better plan for its upcoming cash liquidity needs.
We cover the full definition in our cash flow forecasting guide. The short version is laid out in the table below.
| |
Annual budget |
Cash flow forecast |
| Answers |
Can we afford the year? |
Will cash be there when bills fall due? |
| Layer |
Governance |
Operational |
| Horizon |
Fixed fiscal year |
Rolling, near-term |
| Updated |
Approved once, then locked |
Continuously, against actuals |
Most governments lean on a budget or capital plan as their forward-looking document. But as Luke Otto, Senior Product Specialist at Monetary, puts it, that’s “not truly a rolling cash forecast.” If you’re the treasurer or treasury manager who owns the cash forecast, the first move is to stop asking a budget to do a job it was never built for.
How treasury teams end up running on stale numbers
Rolling forecasts are considered best practice, but only 43% of corporate finance teams use them, per the 2026 AFP FP&A Benchmarking Survey. Public-sector conditions make the discipline harder to sustain. Fund accounting, appropriations, and grant timing all introduce variability that a corporate rolling forecast wasn’t designed to absorb.
That same survey found that only 14% of finance teams formally track forecast accuracy. That leaves the rest with no structured way to know whether last quarter’s numbers held.
“Something that we hear about is assumption drift,” says Otto. “A reimbursement lands late, a project slips, a revenue mix changes, and the model keeps projecting as if nothing moved.”
For most cash managers, the forecast is a spreadsheet built from several manually polled data sources. Refreshing every assumption on schedule rarely happens, so the gaps compound quietly.
A Monetary survey of public finance professionals surfaced a pattern Otto calls a catch-22. “Forecasting doesn’t get listed as the top concern by a lot of finance leaders, yet it consistently shows up as one of the main barriers to doing the job well.”
Why a stale forecast is worse than no forecast
A forecast nobody reconciles doesn’t stop being used. It misleads, because everyone treats its numbers as current.
Otto calls this calcification. A forecast that has calcified is “almost worse than not having a forecast at all,” he says, because it produces false confidence in decisions that depend on:
- How much operating cash to leave sitting idle rather than investing it
- When to draw on a credit line
- Whether a fund can cover its own obligations
“Forecasting feels optional right until the point that you need it and you don’t have it,” Otto says.
A forecast is supposed to be provisional. The discipline is keeping it honest as reality changes. Bryan Lapidus, Director of the FP&A Practice at the Association for Financial Professionals, puts it plainly: “Finance’s response to an unpredictable future must be to maintain multiple points of view of what can happen. Inflexible budgets break.”
The goal is a cash flow forecast whose gaps you can see and explain.
How to fix a stale forecast
The solution to stale forecasting is to set up a rolling forecast that offers a standing comparison of projected versus actual cash flow.
“If you don’t measure it, you can’t manage it,” says Lassiter.
Here are four steps to make that happen:
1. Make the forecast roll
A rolling forecast always looks a fixed distance ahead and slides forward as each period closes. The assumptions inside it don’t refresh themselves, which is how a forecast can keep rolling and still drift stale.
The mechanism is called actualizing. At each period-end, swap the closed period’s projection for real results, then add a fresh period at the far end. “What we want to get to is a rolling thirteen week cash flow,” Lassiter says.
2. Reconcile against actuals, at least every quarter
Once a quarter, put the forecast next to actual bank activity and measure the gap. Align that review to the cycle your board already sees. The forecast rolls forward more often as you position cash, but the quarterly reconciliation is the nonnegotiable check. “What we predicted versus what the actuals were,” in Lassiter’s words, is the comparison that shows where the model held and where it drifted.
3. Adjust the assumptions the variance exposes
A variance report only helps if it changes the next forecast. Where a reimbursement landed late or a project ran long, update your cash-in assumptions and cash-out modeling so the same miss doesn’t repeat. Run what-if modeling on the inflows you trust least.
4. Keep it simple enough to sustain
Rolling forecasts collapse when every update means rebuilding dozens of line items. In government, you usually can’t collapse the fund detail. That level of detail is a floor set by your auditors.
Simplify what you can: the number of assumptions, the update steps, and the manual data pulls. These are the cash flow management strategies worth prioritizing, because a rough forecast kept current is more useful than a precise one nobody maintains.
How Mobile County is working to solve its forecasting problem
After spending the bulk of his career closing books in the private sector, Lassiter is facing the new challenge of rebuilding that discipline inside a government’s cash reality. Mobile County’s commissioners still receive a backward-looking end-of-quarter snapshot.
“We don’t have any kind of predictive report that we give them or a predictive forecast that we provide,” Lassiter says. “It is really just a snapshot.”
In many governments, the work still runs on manually gathering and keying data from several sources into a spreadsheet. The cadence lives or dies on one person’s diligence.
Two variables make Mobile County’s forecast harder to maintain than most. The first is the opening number. A forecast is only as good as the cash position it starts from, which means confirming the opening cash balance against pending deposits and uncleared checks before projecting anything forward.
The second is grants. “With the feds, you never know what you’re going to get,” Lassiter says. “It’s like Forrest Gump and the box of chocolates.” Building those inflows from actual expected dates keeps unpredictable grant timing from skewing the numbers for months before anyone notices.
Both feed the same downstream decision. “You got three buckets, really: your operating cash, your short term investment cash, and your long term investment cash,” Lassiter says.
Getting that split right requires a current forecast. You can move operating cash into higher-yielding investments if you know when you’ll need it back. A stale forecast pushes every liquidity call toward the conservative default, leaving money in low-yield accounts when it could be working harder.
Monetary keeps your cash forecast rolling
Monetary Cash Flow Forecasting is built to enable the forecasting discipline Lassiter is trying to implement.
It gives you a 13-month view of how your cash position is expected to change. Projections are entered on a one-off or recurring basis, with historical averages pre-populating the recurring amounts. When a capital project shifts or new information lands, you update the projection in place. Debt service payments from your debt team flow into the same system, so the obligations most likely to move a fund’s balance are already reflected in the forecast.
Meanwhile, Monetary Variance Analysis compares forecasted amounts against actual transactions coming in from your bank feeds. The predicted-versus-actual comparison runs as a standing view, updated automatically, so the quarterly check doesn’t depend on a manual reconciliation.
With those solutions in place, treasury teams must then have someone accountable for keeping up with quarterly reviews and deciding which assumptions need to change.
Book a demo to see how Monetary’s rolling forecast and variance analysis can benefit your organization.
Related Cash Management Reading
Disclaimer: Monetary does not provide professional services or advice. Monetary has prepared these materials for general informational and educational purposes, which means we have not tailored the information to your specific circumstances. Please consult your professional advisors before taking action based on any information in these materials. Any use of this information is solely at your own risk.
Debt Sizing for Municipal Bonds: A Guide for Issuers
For public finance teams, every major capital project carries two responsibilities: fund the work communities need and protect the trust behind the repayment plan. The par amount, repayment schedule, reserves, and pricing assumptions all shape how confidently your organization can make that commitment.
Debt sizing is where those pressures become numbers. Your team needs to know how much to borrow, how the structure affects repayment, and whether the financing plan can be defended before it moves forward.
That makes municipal bond sizing more than a math exercise. It also flips the question most private-sector finance teams are used to. In corporate and project finance, sizing usually starts with debt capacity: how much borrowing a given revenue stream can support and what structure produces the strongest return. Public issuers work in the opposite direction. The project need comes first, and the sizing question becomes how little debt is needed to fund it on an affordable repayment schedule.
That principle, the least debt that funds the project affordably, is the basis for every sizing decision that follows. It shapes how required proceeds are calculated, how premium and discount are used, how reserves are sized, and how repayment structures are chosen.
What Debt Sizing Means for Public Issuers
Debt sizing for a public issuer starts with the funding need and works backward to the financing structure. Rather than asking how much debt a revenue stream can support, public issuers ask how much money the project requires and what bond structure can provide it while staying within legal, policy, tax, credit, and affordability constraints.
Project Need: What Are You Trying to Fund?
Every financing begins with the project. The first step is determining how much money is needed to complete the capital project or program. That estimate becomes the starting point for every sizing decision that comes next.
Required Proceeds: How Much Cash Must the Financing Generate?
The project cost is only part of the financing. The issuer may also need to fund costs of issuance, reserve requirements, capitalized interest, or other required uses at closing. Together, these items determine the required proceeds: the amount of cash the financing must generate to meet the issuer’s funding needs.
Par Amount: How Many Bonds Should Be Issued?
The par amount is the face value of the bonds the issuer promises to repay over time. It’s often different from the required proceeds because bond premiums or discounts affect how much cash the issuer receives from a given amount of bonds.
At a high level, municipal bond sizing works like this:
Required Project Proceeds
- Costs of Issuance
- Reserve Funding and Other Required Uses − Original Issue Premium (or + Original Issue Discount) = Required Bond Size
The goal is to determine the par amount that gives you the required proceeds while keeping an affordable repayment structure. This new structure should fit within the organization’s broader debt portfolio.
Debt management policy turns those decisions into guardrails. GFOA notes that a debt management policy should support decision-making, guide debt structure, and connect borrowing decisions to long-term financial planning. The sizing model is where those policy goals become numbers.
What Determines the Bond Size?
The par amount is the face amount that has to reconcile what your organization needs to fund with what the financing will actually produce. The cleanest way to see that reconciliation is a source-and-use stack: uses show where money must go, and sources show how the bond issue funds those uses. Each line in the stack is a lever on how much debt the project ultimately carries. Some items push the par amount up; others let the issuer keep it lower.
| Sizing Item |
How It Affects the Par Amount |
Issuer Question |
| Required project proceeds |
Sets the baseline use of funds for construction, acquisition, reimbursement, or another authorized public purpose. |
What amount must be available for the project after closing? |
| Costs of issuance |
Adds transaction costs such as underwriter’s discount, financial advisor fees, bond counsel, disclosure counsel, rating agency fees, and other expenses. |
Which costs are paid from bond proceeds, and which are paid from other funds? |
| Debt service reserve fund |
Adds a required deposit when the bond contract calls for a reserve. |
Is the reserve requirement based on a fixed percentage of outstanding par, maximum annual debt service, or another test? |
| Original issue premium |
Increases available issue proceeds when investors pay more than par for the bonds. |
Can premium reduce the par amount, fund other uses, or change the debt service profile? |
| Original issue discount |
Reduces available issue proceeds when bonds are sold below par. |
Does discount require a higher par amount to deliver the same project proceeds? |
Costs of issuance are usually much smaller than the project itself, but they still affect the amount the issuer needs to borrow. Even relatively modest legal, advisory, underwriting, and rating costs can change the required par amount.
If the financing requires a debt service reserve fund, that deposit becomes another use of funds that must be included in the sizing model. Depending on the bond documents, the reserve can be based on a percentage of par, maximum annual debt service, or another contractual requirement.
In practice, issuers don’t size bonds by looking at the project cost alone. They size the financing for each use of funds and then adjust the par amount until the financing gives the proceeds the project requires.
Original issue premium and discount deserve special attention because they affect how much cash a given par amount generates. The next section explains how pricing changes the relationship between proceeds and bond size.
Premium and Discount Move the Cash
Original issue premium and original issue discount tell you how much cash a bond issue generates without changing the project’s funding need.
On the other hand, the par amount is the principal the issuer promises to repay. The issue price tells you how much cash the issuer actually receives.
Original Issue Premium
When bonds are sold at a premium, investors pay more than the bond’s face value. MSRB notes that original issue premium is treated as proceeds of the issue. That means a premium can increase the cash available at closing and, in some cases, allow the issuer to meet its funding needs with a lower par amount.
Original Issue Discount
Original issue discount works in the opposite direction. MSRB defines it as the amount by which a bond is issued below its par value. Because investors pay less than face value, the issuer receives less cash for each dollar of principal issued. To generate the same project proceeds, the financing may require a higher par amount.
The relationship is simple:
- Premium: More cash for a given par amount
- Discount: Less cash for a given par amount
Pricing assumptions are a core part of debt sizing because they move the par amount without changing what the project needs. A premium structure can let the issuer meet the same funding need with less principal to repay. A discount structure forces the opposite.
For public finance teams, the question is which pricing structure produces the least debt the project can affordably carry, given policy limits and long-term budget plans.
How to Build a Debt Sizing Scenario
Once you know how much cash the financing needs to generate, the next step is building and testing a sizing scenario. The mission is to find a financing structure that funds the project and keeps future debt affordable.
Step 1: List Every Use of Funds
Start with everything the financing needs to pay for. That usually includes the project itself, costs of issuance, any required debt service reserve fund, capitalized interest (if applicable), and other closing requirements.
This gives you the total amount the financing needs to generate.
Step 2: Identify the Sources of Funds
Next, identify where that money will come from. In most cases, the largest source is the bond proceeds, but the financing may also include original issue premium, issuer cash contributions, grants, or other funding sources.
Together, these sources need to cover every planned use of funds.
Step 3: Test the Debt Structure
Once the sources and uses balance, check whether the financing works over a longer period of time. Review the projected debt service, repayment schedule, and affordability against your organization’s debt policy, budget, and long-term financial plans.
Step 4: Compare Different Scenarios
Adjust the par amount, maturities, coupon structure, reserve assumptions, or other financing terms to compare different scenarios. The best scenario is usually the one that funds the project at the lowest par amount the organization can afford to repay, without breaking policy limits or coverage requirements.
A good sizing model makes those tradeoffs visible. If a small change in pricing or assumptions produces a very different outcome, your team should understand why before moving the financing forward.
Structure Choices Shape Debt Service
Getting the bond size right is only part of the decision. The way the bonds are structured tells you how the debt will be repaid over the coming years. Two bond issues can raise the same amount of money but create very different annual debt service. That’s why sizing and structure should always be evaluated together.
GFOA lists repayment structure as a debt structuring practice, including equal annual debt service payments and equal principal amortization. That distinction is practical:
- Level principal: The same amount of principal is repaid each year. Because interest declines over time, total annual debt service gradually falls.
- Level debt service: Total annual payments stay relatively consistent. As interest declines, principal repayments increase.
- Wrapped debt service: Repayments are shaped around existing debt, expected revenues, or future capital plans to avoid unnecessary budget pressure in the early years.
| Structure |
Best For |
Tradeoff |
| Level Principal |
Lower total interest |
Higher early-year payments |
| Level Debt Service |
Stable annual budgets |
Slower principal repayment |
| Wrapped Debt Service |
Budget flexibility |
More debt service later |
For revenue-backed debt, the repayment schedule also affects debt service coverage. Coverage requirements, additional bond tests, and credit considerations can all influence whether a proposed financing is practical.
Other Financing Decisions That Affect Debt Sizing
Maturity, call provisions, interest-rate structure, and credit enhancement don’t change the sources-and-uses math, but they change the long-term cost and flexibility of the debt the issuer will carry. They belong in the same scenario comparison as par amount and amortization.
- Maturity schedule: Determines how long the debt remains outstanding and how principal is repaid over time.
- Call provisions: Give the issuer flexibility to refinance or redeem bonds before maturity if market conditions change.
- Interest-rate structure: Fixed- or variable-rate debt affects future borrowing costs and budget certainty.
- Bond insurance or other credit enhancement: Can improve marketability or borrowing costs but also adds to the overall financing cost.
Each affects affordability, risk, and flexibility over the life of the bonds, and each shapes how much debt the project ultimately carries.
Let Your Team Own the Scenario with Monetary
Advisor support is valuable, but your team still owns the assumptions, trade-offs, and final decision. Bond counsel, disclosure counsel, municipal advisors, underwriters, and internal stakeholders each play a role. GFOA also recommends consulting the right experts before entering into a debt obligation.
But advisor support can only go so far when the scenario workflow is opaque or disconnected. A number changes, the schedule updates, and your team sees the result without always seeing the full assumption chain. That slows the core work of sizing: asking better questions.
Your team can use the scenario model to answer several questions before the financing plan advances.
- What happens if required project proceeds move by 5%?
- Which line item makes the par amount most sensitive?
- Does the reserve requirement change when par changes?
- How does the amortization choice affect maximum annual debt service?
- What happens to coverage when the proposed issue is layered onto the existing debt portfolio?
When your team owns scenario work, expert review becomes more productive. Teams need a place to build their own scenarios or test scenarios financial advisors send, then set the core variables:
- Structure
- Required proceeds
- Interest payment details
- Coupon rates
- Expenses
- Other key assumptions
Testing those variables in-house is how the team answers the core sizing question for itself: what’s the smallest financing that still funds the project on an affordable schedule?
Advisor, counsel, tax, disclosure, market, and pricing expertise stay central. When your team can test assumptions before the next call, the advisor discussion can move from another spreadsheet request to a focused trade-off conversation.
Monetary Sizing is built for that day-to-day operating change. Joshua Benson, Capital Finance Manager for the City of Milwaukee, describes the practical value of running smaller number changes in Monetary before sending every request back to a municipal advisor.
Scenario work becomes visible and repeatable while expert partners remain part of the issuer’s decision process.
Own the Sizing Decision With Monetary
Debt sizing is ultimately an issuer decision. The goal is the least debt that funds the project affordably, and the team closest to the organization’s budget, policy, and long-term plans is best positioned to identify it. While municipal advisors, underwriters, and bond counsel provide essential guidance, your team should be able to understand, test, and compare financing scenarios before the bonds are sold.
Using real portfolio data from your Monetary profile, public finance teams can model new-money financings, compare multiple scenarios side by side, evaluate different repayment structures, and see how a proposed issue affects debt service, coverage, and long-term affordability.
Instead of waiting for revised advisor spreadsheets, you can explore different assumptions in-house and make decisions with a clearer understanding of the tradeoffs.
Sizing is also connected to Monetary’s Debt Management platform. With this, approved scenarios become part of the same system that support debt management, accounting, and year-end reporting.
Schedule a Demo of Monetary to see how the platform helps public finance teams move from understanding debt sizing to owning the decision.
Schedule a Demo of Monetary
Click Here
Bond Issuance Costs: A Plain-English Guide for Public Issuers
Every bond issue comes with a transaction team and a cost stack to match: underwriters, bond and disclosure counsel, municipal advisors, rating agencies, trustees, and disclosure specialists. The fees they charge reduce the money available for projects and shape how financing options compare.
Bond issuance costs are the upfront fees a government pays to bring bonds to market. For public finance teams, the job isn’t just paying them. It’s estimating them during structuring, documenting them at closing, and booking them correctly under GASB 65, which expenses most issuance costs in the period they’re incurred instead of amortizing them over the life of the bonds.
That starts well before closing, when the cost stack is still an estimate.
Why Issuance Costs Matter Before Closing
Issuance costs begin affecting a deal long before the closing documents are finalized. They show up first as estimates during structuring, and every fee ultimately reduces net proceeds, which means it can influence project funding, borrowing needs, and financing decisions.
Before a deal closes, finance teams typically need to understand:
- Which costs are included in the financing
- Which costs will be paid from bond proceeds and which will be paid from other sources
- How the underwriter’s discount affects net proceeds
- How issuance costs will be treated under GASB 65
- What supporting documentation will be needed for accounting and year-end reporting
What Bond Issuance Costs Cover
Bond issuance costs, often called costs of issuance (COI), are the fees paid to the professionals and service providers who help bring a bond issue to market.
In most municipal financings, the cost schedule starts with these categories:
- Underwriter’s discount or gross spread
- Bond counsel and disclosure counsel
- Municipal advisor fees
- Rating agency fees
- Trustee, paying agent, registrar, and escrow agent fees when applicable
- Printing, posting, distribution, and document preparation costs
- Bond insurance premium when the issuer buys insurance
The list changes by transaction. A competitive sale has a different fee pattern than a negotiated sale. A revenue bond with complicated covenants usually requires more legal, disclosure, and rating work than a straightforward general obligation issue. A refunding can add verification agent or escrow agent costs.
The next sections break down these categories in more detail so you can understand where the money goes and how each cost affects the overall financing.
Underwriter’s Discount Sets the Spread
For many municipal bond issues, the underwriter’s discount is one of the largest issuance costs.
In a negotiated sale, the underwriter purchases the bonds from the issuer and resells them to investors. The difference between what investors pay and what the issuer ultimately receives helps compensate the underwriting team for structuring and pricing the bonds.
GFOA’s guidance on pricing bonds in a negotiated sale describes underwriter compensation as underwriter discount or gross spread. While the exact structure varies by transaction, the spread typically includes:
- Takedown: Compensation tied to selling bonds to investors
- Management fee: Compensation for managing and coordinating the underwriting process
- Underwriting risk: Compensation for the risk of holding bonds that are not immediately sold
- Expenses: Transaction-related costs incurred during the sale process
Underwriter compensation is often presented as a dollar amount per $1,000 of par value, a percentage of par, or both. Reviewing the spread in multiple formats can make it easier to compare costs across financing options and bond issues.
Is Underwriter’s Discount the Same as Cost of Issuance?
No. The underwriter’s discount is usually one component of the total cost of issuance, not the entire cost.
The underwriter’s discount compensates the underwriting team for structuring, marketing, pricing, and distributing the bonds. Cost of issuance is a broader category that can also include legal fees, municipal advisor fees, rating agency fees, and more.
| Term |
What It Includes
|
| Underwriter’s Discount |
Compensation paid to the underwriting team |
| Cost of Issuance |
Underwriter’s discount plus other legal, advisory, rating, administrative, and transaction costs |
Issuers often evaluate both. The underwriter’s discount helps assess underwriting costs, while total cost of issuance shows the full expense of bringing the bonds to market.
Professional Fees Build the Team
Beyond the underwriter’s discount, most bond issues include a mix of legal, advisory, rating, administrative, and optional credit-enhancement costs. Each fee supports a different part of bringing the bonds to market.
GFOA calls bond counsel an essential member of a government issuer’s financing team. Bond counsel prepares authorizing documents, assists with tax compliance, supports disclosure documents, and gives the legal opinion on validity and tax treatment. Disclosure counsel focuses on the offering document and securities-law disclosure process.
A municipal advisor represents the issuer in the debt obligation and owes the issuer a fiduciary duty. In practice, that role often includes helping evaluate financing options, structure the transaction, review underwriter proposals, and assess pricing.
Administrative and market-access costs fill out the rest of the schedule:
- Rating agency fees pay for one or more credit ratings on the bonds.
- Trustee or paying agent fees cover administration, payment mechanics, and related duties under the bond documents.
- Printing and distribution costs cover the preliminary official statement, final official statement, posting, document preparation, and closing logistics.
- Bond insurance premium pays for credit enhancement when the issuer buys insurance, guaranteeing that investors will be paid even if the issuer defaults.
GFOA’s debt management policy guidance places professional service providers, rating services, and primary market disclosure inside the broader debt issuance process. That framing is useful because issuance costs pay for the transaction team, market access, and compliance work.
How Issuers Compare Issuance Costs
Looking at the total dollar amount alone rarely tells the full story. A $150,000 cost of issuance might be reasonable for one bond deal and expensive for another, depending on the size and complexity of the financing.
That’s why issuers typically evaluate issuance costs in three ways:
- Total dollars: The actual amount paid
- Cost per $1,000 of par: A standardized way to compare deals of different sizes
- Percentage of par: The share of the borrowing consumed by issuance costs
The calculations are straightforward:
- Cost per $1,000 of par = Cost ÷ Par Amount × 1,000
- Percentage of par = Cost ÷ Par Amount
GFOA’s underwriter-selection guidance recommends that issuers request underwriter compensation in a standardized format, including management fee, underwriting fee, takedown, and expenses. Consistent reporting makes it easier to compare proposals and understand where costs are coming from.
Why Smaller Bond Issues Often Cost More
Smaller issuers often pay more for issuance costs as a percentage of par, even when the dollar amount of the fees appears reasonable.
That’s because many issuance costs are largely fixed. Bond counsel still needs to prepare legal documents. Rating agencies still perform a credit review. Trustees, municipal advisors, and disclosure professionals still complete much of the same work regardless of whether the issue is $5 million or $50 million.
But a fixed fee that looks small on a $50 million deal represents a significant share of proceeds on a $5 million deal. That’s why public issuers often compare issuance costs using both total dollars and percentage-of-par metrics.
How Bond Issuance Costs Get Paid
Bond issuance costs don’t all get paid the same way. Some are paid from bond proceeds, some are paid directly by the issuer, and some are reflected in the amount the issuer receives at closing.
In many municipal bond transactions, the underwriter’s discount is built into the purchase price. Rather than receiving the full par amount, the issuer receives a purchase price that already reflects the underwriter’s compensation, along with any bond premium or discount.
Other issuance costs are often paid through invoices at or around closing. Depending on the transaction structure and applicable requirements, those costs may be paid from bond proceeds or from other legally available funds.
Common payment sources include:
- Bond proceeds used to pay eligible costs of issuance
- Cash contributed by the issuer from another fund or account
- Underwriter’s discount reflected in the bond purchase price
- Separate payments for items with distinct legal or accounting treatment, such as prepaid bond insurance
The closing statement and sources-and-uses schedule show exactly where the money comes from and where it goes. For finance teams, the most important step is reconciliation.
A $25 Million Bond Issue Example
Issuance costs are easier to evaluate when viewed together. The example below shows how a typical cost stack might look for a $25 million bond issue. The amounts here are illustrative planning examples.
Cost Category
|
Illustrative Amount |
$ Per $1,000 Of Par
|
% Of Par
|
| Underwriter’s discount |
$175,000 |
$7.00 |
0.70% |
| Bond counsel and disclosure counsel |
$90,000 |
$3.60 |
0.36% |
| Municipal advisor |
$60,000 |
$2.40 |
0.24% |
| Rating agency fees |
$45,000 |
$1.80 |
0.18% |
| Trustee and paying agent |
$10,000 |
$0.40 |
0.04% |
| Printing, posting, and closing costs |
$15,000 |
$0.60 |
0.06% |
| Total before insurance |
$395,000 |
$15.80 |
1.58% |
| Bond insurance premium, if used |
$125,000 |
$5.00 |
0.50% |
| Total with insurance |
$520,000 |
$20.80 |
2.08% |
A few patterns stand out. As mentioned earlier, the underwriter’s discount is often one of the largest individual costs. Then, legal, advisory, and rating fees make up a significant portion of the total.
Optional credit enhancement, such as bond insurance, can also increase the overall cost of issuance.
For actual transactions, many issuers add columns for payment source, accounting treatment, invoice status, and final closing amount so the estimate can be reconciled to closing documents and financial reporting.
Accounting for GASB 65 Requirements
Under GASB 65, debt issuance costs are expensed in the period incurred, except for prepaid bond insurance. That treatment can differ from bond accounting explanations that describe amortizing issuance costs over the life of the bonds.
The California State Controller’s GASB 65 summary treats fees associated with issuance of long-term bonds, including underwriter fees, as current-period expenses, under GASB 65 paragraph 15. The same summary treats debt issuance costs for prepaid insurance as an asset.
Baker Newman Noyes summarizes the rule the same way in its GASB 65 discussion, noting that debt issuance costs other than prepaid insurance no longer receive deferred treatment and are generally recognized as expense when incurred.
NACUBO’s GASB 65 coverage explains the logic: the insurer continues to provide a benefit over the life of the insurance coverage, so the cost isn’t consumed immediately at closing.
Why the Distinction Matters
If prepaid bond insurance is grouped with other issuance costs, the closing schedule may not support the correct financial reporting treatment.
Separating those costs early makes it easier to prepare accounting entries, support audit requests, and complete year-end reporting.
Monetary Preserves the Trail
For public finance teams, every bond issue creates a documentation trail that runs from pre-deal structuring through year-end financial reporting. Estimates change. Closing figures differ from projections. Accounting entries need to reconcile to the official closing statement, and for a lot of issuers, that reconciliation still means rebuilding the same schedules in Excel every single year, rather than pulling them from a system that already has the data.
Monetary is the integrated solution that keeps all of that connected. During the planning phase, Monetary’s Sizing feature lets teams fold costs of issuance directly into financing scenarios alongside required proceeds, interest rates, and other deal assumptions, so every scenario reflects the true all-in cost of the financing.
After pricing and closing, Monetary carries issuance-cost data into Debt Accounting, where teams can support journal entries and automate long-term obligation disclosures for the ACFR using the same debt record which is the kind of audit-note prep that otherwise eats weeks of manual spreadsheet work at year-end. The result is a single source of truth that keeps issuance costs accurate from structuring through year-end reporting.
See Monetary in action to see how your team can plan, track, and report debt activity from structuring through year-end reporting.
Schedule a Demo of Monetary
Click Here
FAQ
The practical questions around issuance costs usually come down to classification, sizing, payment, accounting, and controls. Use these answers as a working reference, then confirm transaction-specific treatment with your financing team and auditors.
Are Bond Issuance Costs Debt Service?
No. Debt service is principal and interest paid to bondholders over time. Bond issuance costs are upfront transaction costs paid to bring the bonds to market.
Is Underwriter’s Discount An Issuance Cost?
Yes. In a negotiated sale, the underwriter’s discount or gross spread is part of the cost stack. It’s often reflected in the purchase price rather than paid through a separate invoice.
How Are Issuance Costs Quoted?
Issuance costs are typically expressed in three ways: total dollars (the actual invoiced amounts), dollars per $1,000 of par (a normalized view that makes deals of different sizes directly comparable), and percentage of par (the share of the borrowing consumed by issuance costs).
Using all three together is the clearest way to evaluate whether a fee is reasonable, and to compare proposals across different financing options.
Does Bond Insurance Count Differently?
Prepaid bond insurance receives different GASB 65 treatment from most debt issuance costs. In the closing file and accounting workflow, it should stay separate from the rest of the issuance cost stack.
Why Do Smaller Deals Look Costlier?
Many professional fees, rating fees, and administrative costs don’t scale down dollar-for-dollar with par amount. Smaller issues often carry a higher percentage of par for that reason.
Can Bond Issuance Costs Be Paid From Bond Proceeds?
Yes, in many cases. Many municipal bond transactions use bond proceeds to pay eligible costs of issuance at closing. However, the specific treatment depends on the financing documents, applicable law, tax considerations, and the structure of the transaction.
The closing statement and sources-and-uses schedule should show which costs are being paid from bond proceeds and which are being paid from other sources.
Are Bond Issuance Costs Capitalized Under GASB 65?
Generally, no. GASB 65 requires most debt issuance costs to be expensed in the period they are incurred rather than deferred and amortized over the life of the bonds. An exception is prepaid bond insurance, which is typically recognized separately because the insurance benefit extends beyond the issuance date.
What Is Discount Accretion? A Guide For Public Finance Teams
Discount accretion occurs when a bond purchased below its face value gradually increases in value over time, and governments see this concept from both sides: as holders of discounted investments and as issuers of bonds sold below par. The difference between the purchase price and par is recognized over the bond’s remaining life until the carrying value reaches par at maturity.
A discounted bond can sit in two places in public finance: an investment your treasury team holds, or debt your organization issued below par. Even though the math looks similar in both places, the reporting question changes. And in practice, both sides tend to live in the same place today, a spreadsheet that one person built, that ties back to the debt service schedule or the investment ledger in ways only that person fully remembers.
5 Takeaways for Public Finance
- Discount accretion moves a discounted bond’s carrying value toward par over the remaining life of the bond.
- Straight-line accretion spreads the discount evenly, while constant yield applies the effective yield to the current carrying value.
- Government investment reporting has to account for GASB 31, GASB 40, and GASB 72, not only investor-tax adjusted basis rules.
- Issuer-side original issue discount increases reported interest expense as it is amortized over the life of the debt.
- Monetary supports the concept on both sides: issuer-side premium/discount schedules and investment-side GASB reporting workflows.
What Is Discount Accretion?
Discount accretion is the gradual recognition of the difference between a bond’s purchase price and its face value. When a bond is purchased below par, that discount is recognized over time until the bond’s carrying value reaches its full face value at maturity.
Public finance teams encounter this concept from two different perspectives. As investors, governments may purchase bonds at a discount as part of their investment portfolios. Issuers, on the other hand, sell their own bonds at a discount and amortize that discount over the life of the debt.
On the investment side, the discount is part of the holder’s total return because the organization paid less than it will receive at maturity. As the bond approaches maturity, the carrying value gradually increases and the discount is recognized as income.
On the debt side, the opposite perspective applies. If investors purchase your bonds below par, your organization receives less cash at issuance than it ultimately repays. That discount becomes part of the borrowing cost and is amortized over the life of the debt.
The accounting treatment differs depending on whether your organization is the investor or the issuer, but the underlying concept is the same: the gap between the bond’s carrying value and par narrows over time.
| If Your Organization… |
What the Discount Represents |
Over Time… |
| Holds a bond purchased below par |
Additional investment return |
The carrying value rises toward par and the discount is recognized as income |
| Issues bonds below par |
Additional borrowing cost |
The discount is amortized and increases reported interest expense |
This is why the term can feel slippery. Accretion describes the upward movement toward par, but the accounting treatment depends on whether your organization is the investor or the issuer.
Why Public Finance Sees Both Sides
Public entities encounter discount accretion as investors and as issuers, and each side affects a different part of financial reporting. Generic investor pages usually focus on adjusted cost basis and IRS original issue discount rules. Public finance teams report under GASB, which frames each side differently.
On the holding side, GASB 31, GASB 40, and GASB 72 shape how discounted investments are measured, disclosed, and placed in the fair value hierarchy. In practice, that reporting burden is rarely just a valuation question — it’s also a compliance question. Confirming that a discounted security still fits within policy limits on credit quality, maturity, and concentration usually means pulling data from the custodian, the rating agency, and the trade ticket separately, which turns a routine holding into a small research project every reporting period.
On the issuer side, the question is not adjusted basis for a tax lot. It is how original issue discount affects the debt’s carrying amount, interest expense, journal entries, and long-term obligation disclosures, and GASB 62 governs the interest method used to amortize that discount.
Why Public Finance Reporting Differs From Investor Tax Reporting
Many explanations of discount accretion are written for individual investors and focus on IRS rules, adjusted cost basis, and the tax treatment of original issue discount.
Public finance teams usually focus on investment valuation, income recognition, debt accounting, financial statement disclosures, and compliance with GASB standards.
This difference is why a calculation that supports investor tax reporting is not the same calculation or reporting framework used for governmental financial statements. For public entities, discount accretion is ultimately an accounting and reporting concept as much as an investment concept.
Discount Accretion for Investment Holdings
When a government purchases a bond below its face value, the discount becomes part of the investment’s total return. As the bond moves toward maturity, the carrying value gradually increases and the discount is recognized over time.
How that recognition appears in the financial statements depends on the measurement basis. Investments reported at amortized cost generally recognize accretion as interest income on a periodic basis, increasing the carrying value of the investment toward par.
Investments reported at fair value reflect the same economic movement through changes in fair value rather than a separate accretion line. GASB’s implementation guidance explains that once an investment is fair valued, “the market takes into account accreted discounts,” so separate accretion or amortization is generally not necessary for those fair-valued investments.
This is also where a discounted purchase can matter more than it first appears. Most public-sector investment policies rank yield below safety and liquidity, often by statute, and that’s appropriate — but it means yield gains have to come from somewhere other than taking on more risk.
A bond purchased at a discount, held within the same credit-quality and maturity limits a policy already allows, is one of the more overlooked ways a compliant, conservative portfolio can pick up incremental return. Teams tend to get more comfortable capturing it once they trust their own cash forecast enough to hold a security to a longer maturity in the first place.
Unlike many investor-focused explanations, governmental accounting is not primarily concerned with IRS adjusted cost basis rules. The focus is on valuation, income recognition, and financial reporting under GASB standards.
Discount Amortization for Issued Debt
The issuer side works differently.
When a government issues bonds below par, it receives less cash than it will ultimately repay at maturity. That difference is known as original issue discount (OID). This is an additional borrowing cost.
Rather than recognizing the full discount at issuance, governments amortize it over the life of the debt. As the discount is amortized, it increases reported interest expense and affects the carrying value of the liability.
For public finance teams, this side of discount accretion has the greatest operational impact because the amortization schedule continues to affect reporting long after the bonds are issued — and it’s frequently the amortization schedule, not the initial bond math, that ends up being rebuilt by hand in a spreadsheet every year when it’s time to prepare the long-term obligation note for the audit.
How GASB Applies to Discount Accretion
The accounting treatment for discount accretion depends on your organization. In either case, the goal is that the discount must be measured, reported, and disclosed correctly in the financial statements.
Investment Holdings
On the investment side, these are the GASB standards that shape how discounted securities are reported:
- GASB 31: GASB 31 establishes accounting and financial reporting requirements for many investments held by governmental entities and introduced fair value reporting for covered investments.
- GASB 40: GASB 40 requires disclosures related to investment and deposit risks, including credit risk, concentration of credit risk, interest-rate risk, and foreign currency risk.
- GASB 72: GASB 72 establishes the framework for measuring fair value and introduces the fair value hierarchy used in governmental financial reporting.
Together, these standards help determine how discounted investments are measured, valued, and disclosed in government financial statements.
Issued Debt
For issued debt, GASB 62 provides guidance on discount and premium amortization. The resulting amortization affects interest expense, debt carrying values, and related financial reporting throughout the life of the bond. GASB 62 also states that the discount or premium should be reported as a direct deduction from or addition to the face amount of the note, not as a separate asset or liability.
Methods to Accrete Bond Discounts: Straight-Line vs Constant Yield
There are two common ways to accrete a bond discount: the straight-line method and the constant yield (effective interest) method.
The straight-line method spreads the discount evenly over the bond’s remaining life. For example, a $50 discount on a 5-year bond would result in $10 of accretion each year. The method is simple, predictable, and easy to calculate.
The constant yield method ties accretion to the bond’s effective yield. Each period’s accretion is based on the current carrying value of the bond, so the amount generally increases over time as the carrying value moves toward par.
| Method |
How It Works |
What The Schedule Looks Like |
Where Teams Use It |
| Straight-line |
Divides the discount evenly across periods |
Same accretion amount each period |
Simplicity and ease of calculation |
| Constant yield / effective interest |
Applies the effective yield to the beginning carrying value each period |
Accretion grows as carrying value rises |
More precise matching of income or interest expense over time |
For issuers, the effective interest method is the more precise way to match interest expense to the debt’s carrying value.
For investment holdings, the method still helps explain yield and income allocation, but GASB fair value reporting determines how that activity appears in the financial statements.
Worked Example: A $950 Bond Purchased at a Discount
A simple schedule shows why constant yield produces smaller accretion early and larger accretion as the carrying value rises. Assume your organization buys a bond with a $1,000 face value for $950. The bond pays a 4% annual coupon, or $40 per year, and matures in 5 years. The effective yield is about 5.16%.
Under straight-line accretion, the $50 discount is divided evenly across 5 years:
| Year |
Beginning Carrying Value |
Coupon Cash Received |
Discount Accreted |
Ending Carrying Value |
| 1 |
$950.00 |
$40.00 |
$10.00 |
$960.00 |
| 2 |
$960.00 |
$40.00 |
$10.00 |
$970.00 |
| 3 |
$970.00 |
$40.00 |
$10.00 |
$980.00 |
| 4 |
$980.00 |
$40.00 |
$10.00 |
$990.00 |
| 5 |
$990.00 |
$40.00 |
$10.00 |
$1,000.00 |
Under constant yield, each year’s interest income is calculated by applying the effective yield to the beginning carrying value. The discount accreted is the difference between that effective interest income and the $40 cash coupon.
| Year |
Beginning Carrying Value |
Coupon Cash Received |
Interest Income At 5.16% |
Discount Accreted |
Ending Carrying Value |
| 1 |
$950.00 |
$40.00 |
$49.02 |
$9.02 |
$959.02 |
| 2 |
$959.02 |
$40.00 |
$49.49 |
$9.49 |
$968.51 |
| 3 |
$968.51 |
$40.00 |
$49.97 |
$9.97 |
$978.48 |
| 4 |
$978.48 |
$40.00 |
$50.49 |
$10.49 |
$988.97 |
| 5 |
$988.97 |
$40.00 |
$51.03 |
$11.03 |
$1,000.00 |
The total accretion is still $50. The difference is timing. Straight-line treats each year evenly, while constant yield recognizes that a higher carrying value produces more effective interest in later periods.
Issuer-Side Mirror
The same numbers flip on the issuer side. If a government issued a $1,000 par bond and received $950 in proceeds, the $50 original issue discount is amortized over 5 years. Under straight-line amortization, $10 of discount is added to cash interest expense each year. Under the effective interest method, the amortization grows period by period as the carrying value of the liability rises toward par.
| Year |
Beginning Carrying Value of Liability |
Cash Interest Paid |
Discount Amortized |
Interest Expense Reported |
Ending Carrying Value of Liability |
| 1 |
$950.00 |
$40.00 |
$9.02 |
$49.02 |
$959.02 |
| 2 |
$959.02 |
$40.00 |
$9.49 |
$49.49 |
$968.51 |
| 3 |
$968.51 |
$40.00 |
$9.97 |
$49.97 |
$978.48 |
| 4 |
$978.48 |
$40.00 |
$10.49 |
$50.49 |
$988.97 |
| 5 |
$988.97 |
$40.00 |
$11.03 |
$51.03 |
$1,000.00 |
The carrying value rises in both schedules. The difference is what the movement represents. On the investment side, it lifts income. On the issuer side, it lifts reported interest expense.
Discount Accretion vs Premium Amortization
Discount accretion and premium amortization describe the same basic process from opposite starting points.
If a bond is purchased or issued below par, the discount is recognized over time and the carrying value moves up toward par. This is known as discount accretion.
If a bond is purchased or issued above par, the premium is recognized over time and the carrying value moves down toward par. This is known as premium amortization.
| Scenario |
Starting Point |
Periodic Movement |
Carrying Value At Maturity |
Issuer-Side Effect |
| Discount |
Below par |
Add accretion |
Par |
Increases interest expense |
| Premium |
Above par |
Subtract amortization |
Par |
Reduces interest expense |
A simple way to remember the difference is this: regardless of where the bond starts, the carrying value generally moves toward par as the bond approaches maturity.
For public finance teams, this relationship can serve as a quick reasonableness check. A discount schedule should move upward over time, while a premium schedule should move downward. If the schedule is moving in the opposite direction, it’s usually worth reviewing the assumptions, formulas, or methodology behind the calculation.
Managing Discount Accretion With Monetary
Your organization sits on both sides of discount accretion: your team holds discounted bonds in its investment portfolio, and your organization also issues its own bonds below par. Each side has its own schedules, journal entries, and disclosures, and each side eventually has to reconcile back to the same audited financial statements.
That reconciliation work is also where institutional knowledge risk tends to concentrate, the schedule someone built three years ago, with a methodology only they fully remember, is exactly the kind of thing that becomes a problem the moment that person changes roles.
Monetary is built around that dual reality, with one platform that supports your issuer-side amortization work and another that supports your investment-side reporting work.
Monetary’s Debt Accounting feature supports your issuer-side work by automatically calculating and generating amortization schedules for original issue premium/discount using flexible methodologies, including effective interest rate and straight-line.
Those schedules feed journal entries, accrued interest, amortizations, year-end conversion, and long-term obligation disclosure work, including the audit note itself, generated in a handful of clicks instead of rebuilt in Excel each fiscal year.
Monetary’s Investment Management solution supports your holding-side work by helping your team consolidate investment holdings, track maturities and yields, organize valuation support and income allocation workflows, and support accurate GASB 31, 40, and 72 disclosures.
When discounted holdings sit inside your portfolio, including securities like LGIPs that aren’t held in custody and can otherwise fall out of standard reporting, Investment Management gives your team a clearer path from security-level data to reporting-ready support.
Discount accretion is a bridge concept because your treasury team needs to know how discounted holdings behave inside your investment portfolio, while your accounting team needs issuer-side schedules that tie to interest expense and ACFR reporting. When those workflows share a single source of truth, your organization spends less time reconciling the schedule and more time using the data with confidence.
To see how the issuer-side amortization work and the holder-side reporting work come together in one platform, schedule a demo of Monetary.
Schedule a Demo of Monetary
Click Here
FAQs
The practical questions usually come down to which side of the bond you are on and which measurement basis applies.
What Is Accretion Of Discount In Plain English?
Accretion of discount is the gradual recognition of the difference between a discounted bond’s purchase price and its face value. If a bond is bought below par and matures at par, the discount is recognized over time until the carrying value reaches par.
Is Discount Accretion The Same As Amortization?
Accretion and amortization are closely related terms. Teams often say a discount is accreted because the carrying value increases toward par, while a premium is amortized because the carrying value decreases toward par. GASB implementation guidance notes that accounting literature sometimes uses amortization of discounts and accretion interchangeably, so context matters.
What Is The Difference Between Straight-Line And Constant Yield?
Straight-line spreads the discount evenly across each period. Constant yield, also called the effective interest method, applies the bond’s effective yield to the current carrying value, so accretion rises as the carrying value rises.
Does GASB Require The Same Treatment As IRS Investor Rules?
No. IRS-focused articles often discuss original issue discount, constant yield, and adjusted cost basis for tax reporting. Governments report under GASB, so investment reporting has to account for fair value measurement under GASB 31. GASB 40 and GASB 72 add the risk disclosure and fair value hierarchy requirements that generic investor articles usually leave out.
How Does A Bond Discount Affect An Issuer’s Interest Expense?
For an issuer, original issue discount is part of the cost of borrowing. As the discount is amortized, the periodic amortization is added to cash interest to produce reported interest expense.
Where Does Discount Accretion Show Up In The ACFR?
For issued debt, discount amortization supports long-term obligation schedules, interest expense, journal entries, and related note disclosures in the Annual Comprehensive Financial Report. For investments, the presentation depends on whether the investment is reported at fair value or amortized cost and which disclosures apply.
Why Does This Matter For Public Finance Teams?
Discount accretion affects income, carrying value, interest expense, and disclosure support. More than that, it affects confidence in the numbers your organization uses during close, audit prep, investment review, and debt portfolio reporting — confidence that’s harder to maintain when the schedule depends on one person’s spreadsheet and institutional memory. When the schedule is clear and doesn’t live in one person’s head, the conversation can move from reconciliation to oversight.
Do Governments Use Discount Accretion as Investors and Issuers?
Yes. Governments may hold discounted bonds as investments and recognize accretion as part of investment income. They may also issue bonds at a discount and amortize that discount as additional borrowing cost over the life of the debt.
Does Discount Accretion Matter If Investments Are Reported at Fair Value?
Yes, but it may not appear as a separate reporting item. For investments reported at fair value, the market value already reflects factors such as time to maturity, interest rates, and credit conditions.
The key question for public finance teams is which measurement basis applies to the investment. Under GASB reporting, fair value measurement often matters more than a standalone accretion schedule.
Government Treasury Teams Deserve Better: The Case for Purpose-Built Technology in Public Finance
There is a workforce that sits at the financial foundation of every American community: the government finance and treasury professional. They are often small teams, sometimes a department of one, managing the cash, debt, investments, and compliance obligations of cities, counties, school districts, and public universities. Their work funds the roads we drive on, the schools our children attend, and the emergency services we depend on. And yet, as an industry, we have largely left them behind when it comes to technology.
These teams carry a disproportionate burden. They operate under intense public accountability, strict regulatory requirements, and the constant pressure to do more with less, all while managing workforces that are aging and, in many cases, shrinking.
The institutional knowledge walking out the door when a veteran treasurer retires is not easily replaced, and the manual, spreadsheet-driven processes they leave behind are not a sustainable foundation for the next generation of public finance professionals.
“We do our best with the information we’re given, but we don’t always have the full story in a timely way.” — County Treasurer, Midwestern County
That quote, shared with us by a client, captures the central frustration of government treasury operations today. It’s not a complaint about effort or capability. It’s a structural problem, a technology gap that has persisted far too long.
The Private Sector Gets Tools. Government Gets Spreadsheets.
The treasury technology market is robust, if you work in corporate finance. There are sophisticated, well-resourced platforms built for Fortune 500 treasury departments, commercial banks, and asset managers. These tools handle multi-entity cash consolidation, real-time bank connectivity, forecasting engines, and investment analytics with elegance and depth.
Government treasury teams, by contrast, have been largely served by tools built for someone else and adapted, imperfectly, for their needs. The problem is not just a matter of feature gaps, but a matter of fundamental domain fit. Government treasury operations have requirements that are structurally different from private sector treasury, and generic tools simply cannot address them well.
Consider what is unique to the governmental context: tax-exempt debt and the regulatory compliance that surrounds it; GASB 87 and GASB 96 accounting standards for leases and subscription-based IT arrangements; the rigid seasonality of cash flows driven by property tax collection cycles, debt service payment schedules, and legislative appropriations; bond proceed spend-down requirements and private business use tracking; and the multi-fund, multi-entity reporting structures that characterize virtually every government balance sheet.
These are not edge cases. They are the daily reality of public finance, and they are largely invisible to platforms designed for the private sector.
The Cost of Siloed Data and Partial Visibility
When technology fails to harmonize the myriad systems, spreadsheets, and departmental data sources that government finance teams depend on, the result is not merely inefficiency. It’s a fundamental inability to manage liquidity with confidence.
A recent study conducted by the University of Chicago across 168 local governments, including state agencies, cities, counties, school districts, and higher education institutions, found that treasury teams spend approximately 50% of their time on data assembly: pulling bank balances from multiple portals, reconciling spreadsheets, chasing ERP exports, and manually aggregating information that should be available instantly.
Another 30% goes to reporting and disclosure. That leaves just 20% of capacity for the strategic work that actually matters such as forecasting, scenario analysis, investment optimization, and capital planning decisions.
This is not a reflection of the people doing the work. It’s a reflection of the tools they have been given. When your cash position requires logging into five different bank portals, when your debt service schedule lives in a spreadsheet disconnected from your cash forecast, and when your investment maturities are tracked separately from your liquidity planning, you are not managing treasury, you are assembling data. And the decisions that suffer as a result are not abstract. They are decisions about whether to draw on a line of credit, whether to invest idle cash, whether bond proceeds are being spent on schedule, and whether the community has the liquidity it needs to fund the services its residents depend on.
Government treasury teams spend 50% of their time assembling data, leaving only 20% for the strategic work that actually protects community liquidity.
Unfortunately, many governments are forced to make consequential financial decisions based on partial information, not because they lack diligence, but because the data they need is not accessible in a timely, integrated way. That is frustrating. And in 2026, with the technology that exists, it is also unacceptable.
What Good Looks Like: A Case for Tiered, Disciplined Forecasting
The GFOA has long recommended that governments maintain at least two months of operating expenditures in unrestricted fund balance, and conduct ongoing cash forecasting on a rolling 12-month basis. These are sound guidelines, but they represent a floor, not a ceiling. And critically, they leave open the question of how, operationally, governments should build and maintain the forecasting discipline that makes those guidelines meaningful in practice.
Based on experience working with government finance teams across the country, I would suggest that best-in-class government treasury operations employ a three-tiered forecasting framework:
1. Strategic horizon (12-month rolling): Major inflows and outflows analyzed monthly. Investment maturities modeled against forecasted obligations.
2. Tactical horizon (1–3 months, weekly detail): Specific large payment flows such as debt service, payroll, capital expenditures are identified and matched against maturing investments or available proceeds. Cash and short-term liquidity investments available for redemption should cover up to 2x the average monthly outflow.
3. Operational horizon (daily cash position, 3–5 day outlook): Prior-day bank statements reviewed daily. Near-term payment flows forecasted using invoice-level detail, payroll schedules, debt service settlement dates, and other material flows.
Each tier serves a different decision and together they create the layered confidence that transforms a treasury operation from reactive to proactive.
The Forecast-to-Actual Feedback Loop: The Most Underappreciated Best Practice
Of all the operational disciplines in government treasury management, the one I would most want to see elevated in formal best practice guidance is the forecast-to-actual variance process. No forecast is perfectly accurate, the nature of governmental cash flows, driven by legislative cycles, grant timing, tax collection patterns, and factors outside treasury’s direct control, makes perfect prediction impossible. It’s simply reality.
What matters is the discipline of regularly comparing forecast projections against bank-reported actuals, identifying where and why variances occurred, and using those insights to tighten future forecasts. This should be done at minimum monthly and more frequently for governments managing complex or high-volume cash flows.
The value of this discipline extends well beyond forecast accuracy. A structured variance review enables finance teams to roll forward late receipts that did not materialize in the forecasted period; identify unexpected disbursement behavior, which also functions as an important internal fraud control; monitor bond proceeds drawdowns and confirm that expenditures are executing on schedule; and capture new investment maturities that may affect near-term liquidity. It also enables finance directors and CFOs to respond with confidence when city managers or finance committees ask about cash flow budget performance, a question that too often catches treasury teams flat-footed because the analysis was not being done in real time.
The bank statement is the source of truth. The forecast is a hypothesis. The variance analysis is how you learn. Governments that build this discipline into their operating rhythm, rather than waiting until month-end or quarter-end to see where cash landed, are fundamentally better positioned to manage liquidity and protect the communities they serve.
Modern Technology Changes What is Possible
The good news is that the technology to support all of this now exists and for the first time, it is being built specifically for government.
Modern bank connectivity solutions, ERP integrations, and purpose-built treasury platforms now make it possible for government finance teams to have a single, integrated view of cash positions across multiple banks and custodians; a living cash flow forecast that draws automatically from debt service schedules, investment maturities, payroll systems, and AP data; real-time forecast-to-actual variance analysis without manual data assembly; and the compliance and disclosure outputs that government finance requires, from GASB compliance across debt, investment, lease and subscription management, to ACFR footnotes and investment policy reporting.
The vision is not incremental improvement on a spreadsheet model. It’s a fundamentally different operating posture, one where the data speaks for itself, where decisions are informed by a confident and complete picture, and where treasury professionals spend their time on the analysis and judgment that only they can provide.
This matters not just for the efficiency of finance departments. It matters for the communities those departments serve.
When a government treasurer has a confident, real-time view of liquidity, they can make better decisions about when to invest idle cash, when to draw on a credit facility, when bond proceeds are available to fund a capital project, and whether the government has the financial resilience to absorb an unexpected shock.
When that visibility is absent, when the picture is assembled from stale spreadsheets, partial bank data, and disconnected systems, those decisions are made with less confidence than they deserve.
The Obligation to Do Better
Government finance professionals have accepted a level of technological limitation for too long, not because they lack ambition, but because the market did not offer them viable alternatives. That is changing. And as it changes, I believe those of us who work alongside these teams have an obligation to advocate loudly for the standards, tools, and practices that will allow them to do their jobs with the confidence and capability that their communities deserve.
The GFOA guidelines on cash forecasting and fund balance reserves are a strong foundation. But guidelines are only as powerful as the operational infrastructure that supports them. Technology that unifies data, automates the routine, and surfaces insight is not a luxury for government treasury operations, it is a necessity. And the communities we live and work in are better served when the finance professionals protecting their liquidity have the tools to do so.
The Impact of Treasury Discipline: What the University of Chicago Study Reveals
Learn More
Related Treasury Management Reading
Disclaimer: Monetary does not provide professional services or advice. Monetary has prepared these materials for general informational and educational purposes, which means we have not tailored the information to your specific circumstances. Please consult your professional advisors before taking action based on any information in these materials. Any use of this information is solely at your own risk.
What Are Local Government Investment Pools?
Most local government investment pools (LGIP) guidance treats the pool as a product decision. For a public finance team, it’s closer to an operations decision.
The vehicle itself is simple.
The work that determines whether it actually does its job is choosing it for the right purpose, accounting for it correctly under GASB, and connecting it to the rest of your cash and investment picture.
A LGIP is a pooled investment vehicle, operated by a state or a joint group of public entities, that allows governments to invest cash collectively. Similar in concept to a money market fund, an LGIP pools participant deposits and invests them in a portfolio of short-term, high-quality securities designed to preserve capital, provide liquidity, and generate income.
That definition is the easy part. The rest of this guide covers the harder part: how pools work in practice, where stable-NAV and variable-NAV structures fit, what GASB 79, 31, 40, and 72 require, how to evaluate a pool against your investment policy and cash forecast, and how to manage the position once the money is in. Yield comes up in each of those sections. It is the last question, not the first.
What is an LGIP?
An LGIP gives eligible public entities access to a professionally managed portfolio without requiring each organization to build that portfolio on its own.
The Government Finance Officers Association (GFOA) describes LGIPs as pooled investment funds typically overseen by a state treasurer or authorized governing board for the benefit of public entities within the jurisdiction. Governments participate by purchasing shares or units in the pool, which invests participant funds in a diversified portfolio of short-term securities.
While the structure resembles a money market fund, LGIPs are built for public entities and typically rely on a governmental exemption from SEC mutual fund registration. Oversight, eligible investments, and participant rules come from state law and the pool’s governing documents rather than SEC Rule 2a-7.
For many public entities, managing a diversified short-term investment portfolio internally may not be practical. By participating in an LGIP, governments gain access to capabilities that might otherwise require significant internal resources, including:
- Professional portfolio management
- Diversification across multiple securities
- Economies of scale
- Regular reporting and transparency
- Liquidity designed for public-sector cash needs
LGIPs Are Designed Around Public Funds Priorities
Unlike investment strategies focused primarily on maximizing returns, LGIPs are generally structured around the priorities that govern public funds management. While specific objectives vary by state and pool, most focus on:
- Safety of principal
- Liquidity for operating and cash-flow needs
- Yield, consistent with safety and liquidity objectives
- Compliance with applicable laws and investment policies
- Transparency and accountability for participants
For most public entities, preserving capital and maintaining liquidity take precedence over pursuing additional yield. As a result, LGIPs are typically evaluated as cash-management and liquidity tools rather than long-term investment vehicles.
How LGIP Accounts Work
An LGIP participant usually opens an account with the pool sponsor so authorized users can move money under the pool’s operating procedures. In day-to-day use, that process looks familiar to a treasury team.
- Deposits move by wire, ACH, or another approved transfer method.
- Redemptions are requested through the pool’s portal, phone process, or written instruction.
- Same-day access depends on the pool’s cutoff times, transaction rules, and liquidity procedures.
The pool then invests the combined cash in permitted instruments. Depending on state law and pool policy, eligible investments can include:
- U.S. Treasury obligations
- Federal agency securities
- Municipal obligations
- Certificates of deposit
- Commercial paper
- Repurchase agreements
- Other short-term instruments
The participant does not own a specific bill, note, or security, but instead owns a share or unit of the pool. Yield is earned by the portfolio and allocated back to participants according to the pool’s methodology.
GFOA notes that interest is normally allocated daily, proportionate to the participant’s investment. Some pools credit interest monthly, while others compound and pay earnings daily. The pool’s information statement or operating procedures should explain the calculation method, crediting schedule, fee treatment, and statement presentation.
Those statements become source documents for accounting, reconciliation, cash reporting, and financial statement support. For many public finance teams, that information should not be standalone statements reviewed only at month-end. The mechanics of moving money in and out of a pool are simple. The operating work those mechanics create, recording earnings, reconciling balances, tying activity back to the right fund, is where most of the time goes.
For example, Washington State’s Local Government Investment Pool allocates net earnings daily based on each participant’s pro rata share of total pool deposits, then credits those earnings to participant accounts at month-end. A government that increases its balance during the month earns a larger share of the pool’s income based on the amount and timing of those deposits. The same reporting framework also supports participant statements, reconciliation, and cash-position monitoring.
Stable NAV and Variable NAV
One of the most important factors when evaluating an LGIP is whether the pool operates with a stable net asset value (NAV) or a variable NAV.
NAV is the value of one share or unit in the pool. A stable-NAV pool seeks to maintain a constant share value, often $1.00 per share. These pools are typically designed for liquidity, capital preservation, and minimal price volatility, making them well-suited for operating cash, payroll reserves, debt service funds, and other balances that may be needed on short notice.
Many stable-NAV pools are designed to meet the criteria established by GASB Statement No. 79, which permits qualifying external investment pools and their participants to use amortized cost-based measurement for financial reporting instead of fair value measurement.
A variable-NAV pool allows the share value to move with the market value of the underlying portfolio. These pools may hold longer-term securities or take more interest-rate exposure in pursuit of higher yield. That can make sense for money with a longer time horizon, but it changes the risk profile: the amount you redeem may be higher or lower than the original investment amount.
| Pool Type |
Typical Objective |
Best Fit |
Trade-Off |
| Stable NAV |
Maintain a constant share value, commonly $1.00 |
Operating liquidity and funds that need minimal price volatility |
Yield may be lower than longer-duration options |
| Variable NAV |
Allow share value to fluctuate with market prices |
Longer-term reserves or strategic cash with more flexibility |
Principal value can move up or down |
GFOA’s guidance makes this distinction central to due diligence. Stable-NAV pools are used for funds that prioritize liquidity and stability, while variable-NAV pools may be better suited for cash that can tolerate market fluctuations in exchange for the potential for higher returns.
Importantly, a stable NAV does not eliminate risk. Even when a pool seeks to maintain a constant share price, participants should still evaluate the pool’s portfolio composition, liquidity profile, governance structure, and investment policies.
This is where many organizations get into trouble. They compare yield without first matching the pool to the cash need. A government funding next week’s payroll has different liquidity needs than one investing reserves that may not be used for several years. Matching the pool’s structure to the expected use of funds is often more important than maximizing return.
Rated and Unrated Pools
Another important consideration is whether an LGIP carries a rating from an independent rating agency.
Ratings can provide an additional layer of due diligence by assessing factors such as portfolio credit quality, liquidity, diversification, maturity structure, management practices, and governance.
For stable-NAV pools, ratings generally focus on principal stability and the pool’s ability to maintain a constant share value. For variable-NAV pools, ratings may also consider sensitivity to changing market conditions and price volatility.
A strong rating can help treasury teams compare pools and may support compliance with investment policies that require or prefer externally rated investments. However, ratings are opinions based on established methodologies and ongoing surveillance. They are not guarantees of performance, liquidity, or principal preservation.
| Consideration |
Rated Pool |
Unrated Pool |
| Due diligence |
Includes an independent rating opinion |
Relies more heavily on your own review |
| Policy compliance |
May help satisfy policies that reference ratings |
Must be permitted under policy and state law |
| External validation |
Ongoing surveillance by a rating agency |
No third-party rating assessment |
| What to review |
Rating report plus pool disclosures |
Pool disclosures, governance, and portfolio details |
| Key question |
Does the rating align with your risk needs? |
Does the pool provide enough transparency and oversight? |
A rating can provide an additional point of comparison, particularly for organizations whose investment policies reference external ratings.
Likewise, an unrated pool is not necessarily riskier than a rated one. Many state-sponsored pools operate under conservative investment policies, statutory investment restrictions, and strong governance frameworks without obtaining a formal rating.
Whether a pool is rated or unrated, finance teams should evaluate several key questions:
- Does the pool’s investment strategy align with the purpose of your funds?
- Do the pool’s liquidity provisions support your expected cash-flow needs?
- What information is available about portfolio holdings, maturities, credit quality, and risk exposure?
- Does the pool provide sufficient reporting for accounting, reconciliation, disclosure, and audit support?
- Does participation comply with your governing statutes and investment policy?
The key question is not whether a pool is rated, but whether its structure, reporting, liquidity profile, and risk characteristics align with your organization’s requirements.
Why Public Entities Use LGIPs
LGIPs are popular because they solve a real operational problem: public entities need cash to work harder without sacrificing liquidity or policy control. The order matters, though: safety of principal first, then liquidity for operating needs, then yield consistent with both. Reading the same set of benefits as a flat feature checklist, with yield carrying the same weight as safety, is how teams end up in the wrong pool.
For smaller organizations, the benefit is scale. A township, school district, or public authority may not have the staff to manage a laddered portfolio, monitor credit quality, compare market rates, and process daily liquidity needs. A pool gives that organization access to a larger portfolio, full-time investment management, and participant reporting.
For larger organizations, the benefit is flexibility. An LGIP can serve as the daily liquidity layer. Bank deposits, direct securities, separately managed accounts, and other authorized investments can support different cash needs.
For most public entities, the main benefits fall into five categories.
- Liquidity: Many pools are designed for same-day or next-day access, subject to cutoff times and pool rules.
- Diversification: Participants gain exposure to a pool of securities rather than a single bank account or issuer.
- Professional Management: The pool sponsor or adviser manages credit, maturity, liquidity, and compliance within the pool’s policy.
- Economies of Scale: A larger pooled portfolio can access investment options, pricing, and operational resources individual participants may not reach alone.
- Competitive Yield: Pools often aim to provide a market-based short-term return while keeping safety and liquidity at the center.
Washington’s State Treasurer, for example, describes its LGIP objectives in priority order: safety of principal, adequate liquidity, and a competitive interest rate. That sequence is the public funds mandate in plain English, and it is the test for whether a given pool fits a given dollar.
The Risks Behind the Yield
LGIPs are generally designed to prioritize safety and liquidity, but they are not risk-free. Understanding how a pool manages risk is an important part of due diligence.
| Risk Type |
What It Means |
What to Review |
| Credit risk |
An issuer or counterparty fails to meet its obligations |
Credit quality, diversification, portfolio holdings |
| Interest-rate risk |
Changes in rates affect investment values |
Portfolio maturity profile, WAM, NAV structure |
| Liquidity risk |
Access to cash may be affected during unusual conditions |
Withdrawal procedures, liquidity requirements |
| Governance risk |
Oversight, policies, or controls may be inadequate |
Management structure, reporting, transparency |
Credit Risk
Credit risk is the possibility that an issuer or counterparty connected to the portfolio fails to meet its obligations. Diversification can reduce exposure to a single issuer, but it does not eliminate credit risk entirely.
Interest-Rate Risk
When interest rates change, the value of fixed-income securities can change as well. Stable-NAV pools generally manage this risk through short maturities, liquidity requirements, and portfolio constraints. Variable-NAV pools expose participants more directly to market-value fluctuations because share prices reflect changes in the underlying portfolio.
Liquidity Risk
Liquidity risk deserves special attention because access to cash is often the primary reason governments use an LGIP in the first place.
Many pools offer same-day liquidity under normal market conditions, but that does not always mean unlimited withdrawals at any time. Pool policies may include:
- Advance notice requirements for large withdrawals
- Daily transaction cutoffs
- Limits on certain transaction types
- Provisions designed to protect all participants during periods of market stress
That last category includes what are sometimes called liquidity gates: temporary restrictions on redemptions, redemption fees, or pro rata withdrawal limits a pool can impose under stress to protect remaining participants. Routine cutoff times are not gates. Gates are emergency mechanisms that should be understood before they are needed.
Finance teams should review these procedures carefully and ensure they align with expected cash-flow needs.
Governance Risk
A pool’s investment results depend not only on its portfolio but also on its governance framework. Oversight structures, investment policies, transparency, reporting practices, and risk controls all influence how a pool operates and responds to changing market conditions.
What “Not FDIC Insured” Actually Means
LGIP investments are generally not insured by the Federal Deposit Insurance Corporation (FDIC). Unlike a bank deposit, a pool participation unit represents an investment interest in a portfolio of securities, so it also sits outside the protections that apply to other vehicles. There is no SIPC coverage as there would be for a brokerage account, no state collateralization requirement as there typically is for public deposits, and no federal guarantee of the underlying securities unless those securities are themselves Treasury or agency obligations.
That also means participants should not assume the state, sponsoring entity, or pool administrator automatically guarantees principal or performance unless the pool’s governing documents explicitly say so. Public entities can use LGIPs prudently and successfully, but leadership should understand the distinction between a bank deposit, a Treasury security, a money market fund, and an LGIP investment.
Who Can Participate
Eligibility depends on state law, pool documents, and the pool’s governing structure. While requirements vary by jurisdiction, many LGIPs are designed for public-sector participants, such as:
- Cities and municipalities
- Counties
- School districts
- Special districts
- State agencies
- Public colleges and universities
- Public authorities and other political subdivisions
Some pools may also permit participation by tribal governments, public hospitals, or other eligible entities authorized under state law.
Before opening an account, confirm that participation is permitted under both applicable law and your organization’s investment policy.
Typical Participation Process
Once eligibility is confirmed, onboarding generally involves:
- Reviewing the pool’s information statement, investment policy, operating procedures, audited financial statements, and fee schedule.
- Obtaining governing body approval, if required.
- Submitting account-opening documents, authorized signer information, tax forms, and banking instructions.
- Establishing internal controls for deposits, withdrawals, reconciliation, and reporting.
- Determining which funds and accounts are appropriate for pool participation.
That final step is the most important for public finance teams. Eligibility answers whether a government can use an LGIP; investment planning answers which funds should use it.
Operating cash, reserve funds, debt service accounts, bond proceeds, and restricted grant funds may each have different liquidity, legal, policy, and reporting requirements. A well-managed investment program evaluates the purpose of the cash before selecting the investment vehicle, ensuring that liquidity needs and investment objectives remain aligned.
GASB Rules for LGIPs
LGIP accounting depends on the pool’s structure, measurement basis, and reporting characteristics.
GASB standards matter because LGIP participation appears in a public entity’s financial records and financial statement support. The relevant standards include GASB 79, GASB 31, GASB 40, and GASB 72.
GASB 79
GASB Statement 79 addresses certain external investment pools and pool participants. It establishes criteria that allow a qualifying external investment pool to measure all of its investments at amortized cost for financial reporting.
The criteria start with how the pool transacts with participants. They also cover portfolio maturity, quality, diversification, liquidity, and shadow pricing requirements.
If a pool qualifies, participants can report their position using the pool’s amortized-cost information. If the pool does not qualify, fair value measurement becomes more important.
In the financial statements, that typically means LGIP holdings appear in the deposits and investments note at amortized cost, with disclosure that the pool measures at amortized cost under GASB 79.
GASB 31
GASB 31 establishes how governments account for and report investments and external investment pools in their financial statements.
In practical terms, it is one reason LGIP holdings cannot be treated like informal cash balances. They are investments or cash equivalents with reporting requirements attached. On the face of the financial statements, this drives how LGIP balances are classified, whether as cash equivalents or investments, and how income from the pool is recognized.
GASB 40
GASB 40 requires governments to disclose the risks associated with their deposits and investments. For LGIP holdings, that may mean reporting information related to credit risk, interest-rate risk, concentration risk, custodial credit risk, or other exposure, depending on the pool and the participant’s financial statement requirements. These disclosures typically appear in the deposits and investments note and may reference the pool’s weighted average maturity, credit ratings, and any concentration above the participant’s policy threshold.
GASB 72
GASB Statement 72 defines fair value and provides guidance for fair value measurement and related disclosures. It generally requires investments to be measured at fair value unless an exception applies, and it establishes the fair value hierarchy used in disclosures.
For LGIP participants, the accounting question is whether the organization can support the measurement, classification, income recognition, and disclosure treatment used in its financial statements. When fair value applies, LGIP positions are categorized in the fair value hierarchy, most often Level 2, and disclosed accordingly. When the pool qualifies under GASB 79, the holdings are reported at amortized cost and excluded from the hierarchy, which still has to be noted.
What Your Team Must Track While Managing LGIP Holdings
A participating government needs more than the current pool balance to manage LGIP holdings well. At a minimum, your treasury and accounting teams should be able to track:
- Pool name and sponsor
- Account or subaccount structure
- Fund, project, department, or purpose tied to each balance
- Deposits, withdrawals, transfers, and authorized users
- Daily or monthly yield
- Interest earned and credited
- Fees, if not already netted from yield
- NAV or fair value factor, when applicable
- Stable-NAV or variable-NAV classification
- Rating status and rating changes, if applicable
- Portfolio reports and holdings data
- Investment policy compliance
- GASB measurement and disclosure support
- Journal entries for income, fair value adjustments, and reclassifications
- Liquidity assumptions used in cash forecasting
This is where the LGIP becomes part of the operating system of public finance. The pool may provide the data, but your organization still needs to connect that data to fund accounting, cash forecasts, board reporting, and audit support.
When that work lives in spreadsheets, teams are left reconciling statements, manually allocating interest, checking policy limits by hand, and rebuilding the same support schedules every reporting cycle.
That can create a larger problem than wasted time: the numbers become harder to trust when the organization most needs confidence.
How to Evaluate a LGIP for Your Organization
The best LGIP is the one that fits your organization’s cash needs, investment policy, and risk tolerance. Before comparing yields, make sure the pool aligns with your legal requirements, liquidity needs, reporting obligations, and investment objectives.
A higher yield may come from longer maturities, different credit exposure, or a variable-NAV structure that is not appropriate for the funds you plan to invest.
Use the following framework when evaluating an LGIP:
| Review Area |
Questions to Ask |
| Legal Authority |
Is the pool authorized under state law, local policy, bond documents, grant restrictions, or board policy? |
| Investment Objective |
Is the pool designed for stable liquidity, enhanced yield, or longer-term reserves? |
| NAV Structure |
Does it seek a stable $1.00 NAV, or does NAV fluctuate? |
| Eligible Investments |
Are the pool’s permitted securities allowed under your organization’s investment policy? |
| Maturity and Duration |
What weighted average maturity, final maturity limits, and duration limits apply? |
| Credit Quality |
What ratings, issuer limits, diversification rules, and counterparty controls apply? |
| Liquidity |
What are the cutoff times, redemption rules, large withdrawal procedures, and liquidity thresholds? |
| Fees and Yield |
Are published yields net of fees, and how are earnings calculated and credited? |
| Reporting |
Does the pool provide statements, holdings, fair value data, GASB support, audited financials, and monthly reports? |
| Governance |
Who oversees the pool, who manages assets, and how often does the board review performance and compliance? |
| Operational Fit |
Can your team reconcile activity, assign balances to funds, monitor policy limits, and forecast liquidity without manual workarounds? |
Operational fit matters as much as the pool itself. A high-quality pool still needs internal processes that let your team:
- Tie balances to the right fund
- Record investment income accurately
- Show leadership how the position fits into the broader liquidity plan
Where LGIPs fit in Your Investment Strategy
LGIPs work best when they have a defined role in your liquidity and investment strategy.
For many organizations, the pool belongs in the liquidity tier. That means it supports near-term cash needs, operating reserves, payroll, vendor payments, debt service, or project draws. In this role, the pool is judged by availability, safety, reporting clarity, and policy compliance before yield.
Other funds may sit in a reserve or strategic tier. These dollars can tolerate more structure because they are not needed immediately. A variable-NAV pool, laddered securities, separately managed account, or longer-duration instrument may be more appropriate there, depending on policy and risk tolerance.
A simple liquidity map can keep the decision grounded:
- Daily Liquidity: Bank balances, stable-NAV LGIPs, and other instruments available immediately or nearly immediately.
- **Short-term Liquidity:** Investments matched to known obligations within weeks or months.
- Strategic Reserves: Funds with a longer horizon and more ability to absorb price movement.
Each dollar needs a job. Cash needed tomorrow should stay close to operations. Reserves needed next year can support a different strategy if the team has visibility into future cash needs.
Put the Pool in Your Larger Investment Strategy
The practical test for an LGIP reaches beyond the rate sheet. Your team should be able to answer four questions:
- What is the money doing?
- Why does it belong there?
- When can it be accessed?
- How will it be reported alongside other cash and investment decisions?
Before the next investment committee meeting, choose one LGIP position and trace it from beginning to end. Start with the source fund and authorized purpose. Your review should confirm the support behind the position.
- Current balance
- Yield
- NAV treatment
- Policy limit
- Next expected cash need
- GASB disclosure support
If that path runs through five spreadsheets and three inboxes, the pool may be working, but the process around it is not.
Public finance teams manage money under a standard of trust. LGIPs support that trust when selection, tracking, and reporting all connect to a complete treasury picture.
Managing LGIP Holdings with Monetary
Monetary is not an LGIP provider. It is a system of record that helps public finance teams manage LGIP positions alongside debt, cash, and other treasury activity. Once funds are invested, treasury and accounting teams still need to track balances, record earnings, support financial reporting, and keep the investment aligned with liquidity needs.
Monetary helps governments centralize investment data, automate reporting for GASB 31, 40, and 72, generate fair value journal entries and valuations, monitor investment policy compliance, and maintain audit-ready records.
Because investment decisions are tied to liquidity planning, Monetary also connects investment holdings, projected cash flows, investment maturities, and debt service requirements. That gives teams a clearer view of how much cash belongs in a pool, how much should remain readily available, and when funds may be needed for operations.
By bringing debt, cash, and investments into a single system, Monetary helps public finance teams manage LGIP holdings with stronger financial controls.
FAQ
Are LGIPs safe?
LGIPs can be conservative investment vehicles, but “safe” depends on the pool’s structure, holdings, maturity limits, credit quality, liquidity rules, governance, and reporting transparency. A stable-NAV pool focused on high-quality short-term instruments has a different risk profile than a variable-NAV pool designed for enhanced return.
Are LGIPs FDIC-insured?
No. LGIP investments are not FDIC-insured when they are pool participation units rather than bank deposits. They are also not automatically guaranteed by the state, sponsor, or governing board unless the pool documents explicitly say otherwise.
Is an LGIP the same as a money market fund?
No, although some LGIPs operate like money market funds. LGIPs are built for public entities and usually rely on the governmental exemption from SEC mutual fund registration requirements. Some follow money market-style operating standards, but oversight, eligible investments, and participant rules depend on state law and pool documents.
What is a stable-NAV LGIP?
A stable-NAV LGIP seeks to maintain a constant share value, commonly $1.00. These pools are often used for liquidity because they aim to minimize price volatility, although they still carry risk and are not guaranteed.
What is a variable-NAV LGIP?
A variable-NAV LGIP allows the share value to fluctuate with the market value of the underlying portfolio. These pools may pursue higher yield through longer maturities or different investment strategies, but participants accept more price movement.
How is LGIP yield paid?
Yield is earned by the pool’s portfolio and allocated to participants according to the pool’s rules. Many pools calculate earnings daily and credit them monthly, while others compound and pay daily. Always confirm whether the published yield is net of fees.
What should a government report for LGIP holdings?
At a minimum, the organization should support its balance, income, measurement basis, fair value or amortized-cost treatment, applicable risk disclosures, and investment policy compliance. GASB 79, 31, 40, and 72 determine how those records appear in the financial statements.
Can bond proceeds be invested in an LGIP?
Sometimes, but only if state law, bond documents, arbitrage rules, and the organization’s investment policy allow it. Bond proceeds often carry additional restrictions, so they should be tracked separately from general operating cash.
How many LGIPs should an organization use?
There is no universal number. Some organizations use one primary pool for liquidity, while others use multiple pools to diversify providers, compare yield, or separate purposes. The right answer depends on policy, controls, reporting capacity, and liquidity needs.
How should you start evaluating an LGIP?
Start with the pool’s information statement, investment policy, operating procedures, audited financial statements, monthly holdings reports, fee schedule, and rating reports if available. Then compare those documents against your governing law, investment policy, cash forecast, and reporting requirements.
Schedule a Demo of Monetary
Click Here
Related Treasury Management Reading
Disclaimer: Monetary does not provide professional services or advice. Monetary has prepared these materials for general informational and educational purposes, which means we have not tailored the information to your specific circumstances. Please consult your professional advisors before taking action based on any information in these materials. Any use of this information is solely at your own risk.
GASB 96 Implementation: 8 Phases from Kickoff to First Audit
For most government accounting teams implementing GASB 96, implementation starts the same way: a folder of contracts from different departments, half auto-renewing, none with an obvious interest rate, and an audit deadline eight months out. When this phase stalls, the consequences show up as audit findings, restated financials, and year-end scrambles.
Most GASB 96 resources explain what the standard requires; this guide covers how to actually implement it, phase by phase, from kickoff to first audit.
The Eight-Phase GASB 96 Implementation Arc
The implementation process breaks into eight phases, each tied to a specific output: a complete SBITA inventory, qualification support, measurement worksheets, opening balances, journal entries, disclosures, and audit-ready documentation.
| Phase |
Output Deliverable |
| 1. Stand Up the Project |
Cross-functional team, timeline, audit-anchored milestones |
| 2. Build the SBITA Inventory |
Complete population of candidate SBITAs with contract documents |
| 3. Qualify Each Contract |
Each contract classified as SBITA, short-term SBITA, or out-of-scope |
| 4. Make the Measurement Judgments |
Subscription term, discount rate, implementation cost staging |
| 5. Calculate Opening Balances |
Per-contract opening liability, asset, and prepaid reclassification |
| 6. Set Up the Journal Entries |
Template producing fund and government-wide entries |
| 7. Prepare First-Year Disclosures |
A disclosure block ready for the audit walkthrough |
| 8. Walk the Auditor Through It |
Audit-ready close, plus year-2 operating cadence |
Phase 1: Stand Up the Project
GASB 96 implementation can’t be done in a silo, and treating it as accounting’s solo project is the most common reason year-one timelines slip.
The standard reaches into IT, HR, facilities, legal, and procurement. Each of those functions signs subscription agreements that meet, or might meet, the SBITA definition. Accounting owns the deliverable, but the people who hold the contracts work in different parts of the building.
Chris Goeman of HeinfeldMeech, an auditor who works extensively with school districts, frames it directly:
“This standard cannot be successfully implemented in a silo. It will require collaboration across departments and especially with the IT department and consultation with your vendors, consultants, and auditors.”
Your Phase 1 deliverable is a project plan tied to the audit calendar. For governments with a June 30 year-end and August-November audit fieldwork, timelines should be built backward from the planned audit walkthrough date.
At a minimum, your plan should define:
- who gathers contracts and vendor data,
- who evaluates the SBITA qualification,
- who documents measurement judgments such as term and discount rate selection, and
- who reviews disclosures and final reporting.
The risk is starting inventory and qualification work too late, which pushes unresolved contracts and judgment calls into year-end close and audit testing.
Phase 2: Build the SBITA Inventory
The first challenge starts here: building a complete SBITA inventory. For most governments, this is the largest year-one workload because subscription agreements are usually scattered across departments and systems that were never originally tracked as SBITAs.
As Goeman notes, GASB 96 extends beyond traditional software subscriptions and can also include infrastructure-as-a-service (IaaS) and platform-as-a-service (PaaS) arrangements, significantly widening the contract population accounting teams need to review.
To pressure-test completeness, your team should:
- coordinate with IT and procurement teams to identify tracked subscriptions,
- review general ledger activity and recurring vendor payments tied to IT spending,
- pull expenditure reports for technology-related object codes, and
- review board meeting minutes and contract approvals for keywords such as “cloud,” “hosted,” “platform,” or “software subscription.”
Your Phase 2 deliverable is the complete SBITA population: every potentially in-scope contract supported by the underlying agreement and related documentation. This is also one of the first areas auditors test heavily during year one because missing contracts immediately raises questions about completeness controls and inventory procedures.
San Joaquin County’s case study shows the challenge at scale. Before centralizing its lease and subscription agreements, the county managed more than 100 contracts across departments using manual spreadsheets and calculations. Having the portfolio in Monetary reduced recalculation work from hours to minutes and simplified audit support by maintaining schedules and documentation in one place.
Phase 3: Qualify Each Contract Against the SBITA Definition
Once the inventory is built, the next step is deciding which contracts qualify as SBITAs, which don’t, and which qualify as short-term SBITAs that get expensed instead of capitalized.
For each contract, three conditions determine SBITA classification: the arrangement conveys the right to use IT software, the government controls that right, and it occurs in an exchange or exchange-like transaction.
Goeman’s guidance here is direct:
“Be careful not to focus on what the agreements are called, rather they should be evaluated in substance.”
The Washington State Auditor’s BARS Manual offers a practical test for the perpetual-license boundary: “Can I still log in and access the IT software after the engagement term ends?”
If the answer is no, it isn’t a perpetual license, and you should evaluate the contract further for SBITA classification.
The standard explicitly excludes several arrangements. Before classifying, confirm the contract falls within scope by checking for common exclusions:
- Contracts treated as leases under GASB 87 when the primary asset is physical equipment or property, and the software component is only incidental.
- Contracts where the government provides a right to use its own IT software to other entities.
- Public-private or public-public partnerships within the scope of GASB Statement No. 94.
- Perpetual licenses subject to GASB Statement No. 51.
- Contracts that only provide IT support services.
Two Common Traps
Two qualification traps surface repeatedly in year-one audits. The auto-renewing agreement is the first.
As Calvin Kunkel of LSL CPAs notes, “Subscription arrangements brought a common challenge that we didn’t see with leases: the annual auto-renewing agreement. Organizations must carefully evaluate the language surrounding renewal terms and who specifically has the right to renew or not renew. If either party has the right to renew or not renew with no approval needed from the other party, this is considered a cancellable arrangement and likely has a term of less than 12-months, depending on other term language in the contract.” That distinction governs whether the contract becomes a capitalized SBITA or an expensed short-term arrangement.
The second trap is the multi-component contract. When a contract bundles components like hardware and software, you must account for the subscription and non-subscription components as separate contracts and allocate the price across them. If allocation isn’t practicable, the contract is accounted for as a single SBITA unit.
A short-term SBITA has a maximum possible term under the SBITA contract of 12 months (or less), including any options to extend, regardless of their probability of being exercised. You recognize short-term SBITAs as outflows of resources based on contract payment provisions, with no asset and no liability recorded.
Your Phase 3 output is a qualification matrix. Classify every contract from the population as SBITA, short-term SBITA, or out-of-scope, with a rationale that holds up to audit review.
Phase 4: Make the Measurement Judgments
This is the phase where the audit lives. Subscription term, discount rate, and implementation cost staging are the three measurement decisions auditors probe in year one.
Subscription Term
Under GASB 96, the subscription term includes:
- the non-cancelable period of the agreement,
- extension periods your organization is reasonably certain to exercise, and
- excludes periods covered by termination options your organization is reasonably certain to exercise.
The key judgment is “reasonably certain.” GASB 96 doesn’t assign a numeric threshold, although some practitioners use informal ranges as internal guidance.
In practice, auditors focus less on the percentage itself and more on the supporting documentation: what renewal or termination options exist, what conclusion the accounting team reached, and what evidence supports that assessment.
Because the subscription term directly affects measurement, amortization, and liability calculations, it is one of the most heavily reviewed judgments during a GASB 96 audit.
Discount Rate
The discount rate under GASB 96 is ultimately a policy and documentation decision. The standard directs you to use the interest rate charged by the SBITA vendor, including any rate implicit in the agreement. If that rate can’t be readily determined, you use your estimated incremental borrowing rate (IBR).
In practice, most SBITA contracts don’t state an interest rate directly. As Goeman notes in GASB 96 SBITA guidance:
“The first step in identifying the discount rate is to review the district’s contract for an explicit interest rate charged. In most cases, there will not be a stated interest rate in the contract.”
That usually pushes governments toward an incremental borrowing rate methodology. The Washington State BARS Manual suggests practical starting points, such as the prime rate or published local bank borrowing rates for comparable terms.
The critical control is consistency. Your organization should adopt a written incremental borrowing rate policy and apply it consistently across the SBITA portfolio. Auditors routinely examine why similar agreements were measured using different discount rates and whether the supporting rationale was documented clearly.
Implementation Cost Staging
Implementation cost classification is where the standard demands the most judgment. GASB 96 groups all outlays other than subscription payments into three stages:
| Stage |
Activities |
Accounting Treatment |
| Preliminary Project Stage |
Conceptual formulation, evaluating alternatives, determining needed technology, final selection |
Expensed as incurred |
| Initial Implementation Stage |
Design, configuration, coding, testing, installation, and other charges to place the asset into service |
Capitalized into the subscription asset (except short-term SBITAs) |
| Operation and Additional Implementation Stage |
Maintenance, troubleshooting, ongoing operations |
Expensed as incurred unless capitalization criteria met |
| All Stages |
Training |
Always expensed as incurred |
Training costs are always expensed regardless of implementation stage, and misclassifying them as capitalizable costs is one of the most common first-year audit findings under GASB 96.
Data conversion costs depend on their purpose. They can be capitalized only when they are necessary to place the subscription asset into service. Otherwise, they are expensed.
Operation-stage costs are expensed unless they improve the subscription asset. GASB 96 allows capitalization when the costs either:
- increase the functionality of the subscription asset by enabling new tasks, or
- improve efficiency by increasing the level of service without adding new functionality.
Your Phase 4 output is a per-contract measurement worksheet: subscription term and rationale, discount rate and policy reference, capitalizable initial-implementation costs, and expensed preliminary-project and operation costs.
Phase 5: Calculate Opening Balances and Place the Asset Into Service
Phase 5 is where your implementation shifts from contract review into accounting measurement. Your team calculates the present value of future subscription payments, determines which implementation costs should be capitalized, and records the opening subscription liability and subscription asset.
Under GASB 96, the subscription term begins when the initial implementation stage is complete, and your organization obtains control of the right to use the underlying IT assets. At that point, the subscription asset is considered placed into service, and your organization recognizes both:
- the subscription liability, and
- the intangible right-to-use subscription asset,
unless the arrangement qualifies as a short-term SBITA.
The initial subscription liability is the present value of the subscription payments expected to be made during the subscription term, and includes:
- Fixed payments
- Variable payments that depend on an index or rate (such as the Consumer Price Index), measured as of the commencement date
- Variable payments that are fixed in substance
- Penalties for terminating the SBITA, if the subscription term reflects an intent to exercise a termination option or a fiscal funding clause
- SBITA incentives receivable from the vendor (treated as a reduction)
- Any other payments to the vendor are reasonably certain to be required
Variable payments based on usage, performance, or number of user seats are not included in the initial liability. Those are “recognized as expenses in the period in which the obligation is incurred.”
The opening subscription asset includes:
- the initial subscription liability,
- any payments made to the vendor before or at commencement, and
- capitalizable implementation costs,
less any vendor incentives received at commencement.
Payments made before the subscription term begins are initially recorded as prepaid assets and later reclassified into the subscription asset once the underlying IT asset is placed into service. This commonly occurs when vendors begin billing during the implementation stage before the government has operational access to the system.
GASB 96 also requires retroactive implementation where practicable. You must restate prior-period financial statements, recording the cumulative effect as an adjustment to beginning net position rather than treating it as a new-period expense or liability.
A worked example helps anchor the math. Take a SBITA with a four-year noncancelable term, $50,000 annual payments at the end of each fiscal year, a 4.5% incremental borrowing rate, and $8,000 of capitalizable initial-implementation costs.
The present value of the four end-of-period payments at 4.5% is:
PV = 50,000 / (1.045)^1 + 50,000 / (1.045)^2 + 50,000 /
(1.045)^3 + 50,000 / (1.045)^4
= 47,846.89 + 45,786.50 + 43,814.83 + 41,928.07
= 179,376.28 (rounds to 179,376)
The opening subscription liability is $179,376. The opening subscription asset is $179,376 + $8,000 in capitalized implementation costs = $187,376. Amortization begins on the commencement date and runs over the shorter of the four-year subscription term or the underlying IT asset’s useful life.
Your Phase 5 output is an opening balance per contract: subscription liability, subscription asset, and the journal entry recording the asset, the liability, and any prepaid-asset reclassification.
Phase 6: Set Up the Journal Entries
By Phase 6, the implementation shifts into recurring close-cycle accounting.
Most year-one GASB 96 accounting revolves around four recurring entries: initial recognition, subscription payments, amortization of the subscription asset, and year-end reclassification of the subscription liability.
- Initial recognition: Debit Subscription Asset and credit Subscription Liability for the present value of future payments, then add any prepaid amounts and capitalizable implementation costs.
- Periodic amortization: Debit Amortization Expense and credit Accumulated Amortization over the shorter of the subscription term or the useful life of the underlying IT asset.
- Interest accretion: Debit Interest Expense and credit Subscription Liability for the interest accrued on the outstanding liability balance.
- Subscription payment: Debit Subscription Liability for the principal portion, debit Interest Expense (or reverse the prior accrual), and credit Cash for the payment amount.
Two technical wrinkles deserve attention.
First, governmental fund reporting and government-wide reporting use different bases. In governmental funds, current-year cash outflows hit expenditures on the modified accrual basis. The asset and long-term liability live in the government-wide statements via conversion entries. The conversion entries are where many off-the-shelf SBITA software outputs miss the mark.
Second, the current-versus-long-term liability split. The principal portion due within the next fiscal year is current; the rest is long-term.
As Calvin Kunkel of LSL CPAs notes, the implementation risk is whether the accounting structure underneath those entries was configured correctly for your organization’s reporting model.
In practice, many lease and SBITA software platforms don’t fully account for modified accrual-to-full accrual conversion entries, memo funds, or the required split between current and long-term liability balances. Those gaps often surface during year-end close and audit testing rather than during initial setup.
Monetary generates comprehensive journal entry exports for subscriptions in a few clicks. Users select key parameters, including start and end date, fiscal year end, payment frequency, and accrual and depreciation entry frequency, then download the report. The Excel export includes full accrual and modified accrual journal entries in a single year-end export rather than several disconnected ones.
Your Phase 6 output is a journal-entry template that produces correct entries for both fund and government-wide reporting, with the current and long-term liability split surfaced cleanly.
Phase 7: Prepare First-Year Disclosures
The final pre-audit step is the disclosure block. GASB 96’s note disclosure list is specific. Each year your organization reports SBITAs, the notes should disclose:
- A general description of your SBITAs, including the basis, terms (length of agreement, options for renewal and termination, discount rate, etc.).
- The total amount of subscription assets and related accumulated amortization, separately from other capital assets.
- Commitments before the commencement of the subscription term.
- Principal and interest requirements to maturity for the subscription liability, presented separately for each of the five subsequent fiscal years and, at a minimum, in five-year increments for the years thereafter.
GASB 96 allows you to aggregate disclosures across multiple SBITAs rather than disclose each contract individually. As the standard states, disclosure information “may be grouped (i.e., aggregated)” instead of being presented contract by contract.
Additional disclosures apply when variable payments, termination penalties, or impairment exist. For variable payments, the notes should cover how they are determined and the total recognized during the reporting period. Two scope boundaries matter: short-term SBITAs are excluded from GASB 96’s disclosure requirements, and subscription liabilities fall outside GASB 88’s debt disclosure rules, even though maturity-style principal and interest schedules still apply.
For this, users can create GASB 96 audit notes. Monetary flags which subscriptions commenced during the selected fiscal year and lets users note additional contracts that may have commenced or require remeasurement.
Your Phase 7 output is a complete first-year disclosure block, aggregated where the standard allows, with variable-payment and impairment disclosures added when applicable, ready for the audit walkthrough.
Phase 8: Walk the Auditor Through It
The year-one implementation project effectively ends at the audit walkthrough. From that point forward, GASB 96 becomes an ongoing operational process rather than a one-time adoption exercise.
During year-one testing, auditors typically focus on six areas:
- completeness of the SBITA population,
- qualification decisions and short-term classifications,
- discount rate support,
- subscription term judgments,
- implementation-cost classification, especially data conversion costs, and
- disclosure reconciliation back to the underlying schedules and journal entries.
Each of those areas traces back to the workpapers and controls established during Phases 2 through 7.
Strong documentation is what keeps the audit process manageable. Your auditor should be able to trace every reported balance back to the source contract without additional reconstruction. As LSL CPAs notes in its GASB 87/96 implementation guidance, many accounting teams struggled during year-end close because calculations and schedules were fragmented across spreadsheets.
Year 2 introduces a different set of challenges. GASB 96 requires remeasurement when subscription terms change, payment estimates change, variable-payment contingencies resolve, vendor interest rates change, or previously unused options are exercised. New subscriptions also continue entering the population while older agreements update.
The final output of Phase 8 isn’t just a compliant year-one implementation. It’s a repeatable operating process for maintaining GASB 96 compliance in every reporting cycle that follows.
From Operational Overload to a Defensible Year-End
Each dollar that flows through a government’s subscription portfolio comes from taxpayers. The first-year close is the artifact that demonstrates how that portfolio is governed: every SBITA is identified, qualified, measured, recorded, and disclosed in a way the audit report can affirm.
Monetary Subscription Management helps governments by centralizing subscription agreements, supporting remeasurements and modifications, and maintaining audit-ready schedules and documentation throughout the SBITA lifecycle.
To fix your own implementation, book a demo with Monetary to see how it turns the eight-phase arc into a workflow your team owns rather than a deadline it chases.
Related GASB 96 Reading
Disclaimer: Monetary does not provide professional services or advice. Monetary has prepared these materials for general informational and educational purposes, which means we have not tailored the information to your specific circumstances. Please consult your professional advisors before taking action based on any information in these materials. Any use of this information is solely at your own risk.
GTreasury Alternatives: We Reviewed 7 Options for 2026
You’re searching for GTreasury alternatives, which means something isn’t working. Maybe the platform doesn’t speak your compliance language, the implementation never delivered on its promise, or your debt manager is retiring next year and you need a system that survives the transition. Whatever brought you here, the answer depends on one question: what sector do you operate in?
The treasury management market is crowded with platforms built for corporate finance teams managing global cash pools, FX risk, and payment networks. For organizations in state and local government, higher education, healthcare, and the nonprofit sector, that mismatch means evaluating tools that look right on paper but miss the workflows that consume most of your time: GASB compliance, debt portfolio tracking, and Annual Comprehensive Financial Report (ACFR) generation. A platform that automates cross-border payments but can’t produce an audit-ready footnote creates a different kind of problem.
The criteria that actually separate these platforms: public sector compliance depth, debt portfolio specificity, implementation burden, AI maturity, and key-person risk mitigation. Corporate treasury teams will find honest assessments of which tools serve their needs.
TL;DR
- Choose Monetary if your organization operates in state or local government, higher education, healthcare, or the nonprofit sector and needs native GASB compliance automation, debt portfolio management, and ACFR footnote generation built into the same platform.
- Choose Kyriba if you run enterprise corporate treasury operations with global cash pools, FX exposure, and complex payment networks that require connectivity to thousands of banks and ERPs.
- Choose Trovata if you lead a mid-market corporate treasury team that wants fast, modern multibank cash visibility without a months-long implementation.
- Choose SAP Treasury and Risk Management if your organization already runs SAP S/4HANA and needs treasury, cash, and payments unified inside that existing environment.
- Choose Integrity SaaS Treasury Management if your mid-to-enterprise organization needs broad treasury and risk functionality including hedge accounting within a single platform.
- Choose Nomentia if your global enterprise needs centralized payment orchestration across thousands of banks and currencies.
- Choose Agicap if you’re a European SMB or mid-market company managing multi-entity cash flow with a lean finance team.
Most treasury management tools are built for corporate finance. If your organization answers to GASB standards, manages a debt portfolio measured in hundreds of millions, and produces an ACFR, Monetary is the only platform in this set designed for that reality from the ground up.
Get a Demo of Monetary Today
Click Here
The best GTreasury alternatives at a glance
A quick look at the best GTreasury alternatives
Tool
|
Standout Feature
|
Starting Price
|
Best For |
| Monetary |
Automated Long-Term Obligation Disclosure |
Contact for pricing |
Governments, higher education, healthcare, and nonprofits |
Kyriba
|
Agentic AI for cash forecasting |
Custom pricing |
Midsize to enterprise companies across industries |
| Treasury and Risk Manager – Integrity Edition |
Treasury GPT |
Custom pricing |
Mid-sized to enterprise organizations with treasury needs |
| SAP Treasury and Risk Management |
S/4HANA integration, AI reconciliation, hedge accounting audit trail |
Custom pricing |
Large and enterprise existing SAP customers |
| Trovata |
Trovata AI |
$24,000/year |
Mid-market to enterprise treasury finance teams |
| Agicap |
AI-Powered Transaction Categorization |
Custom pricing |
SMBs and mid-market companies across sectors |
| Nomentia |
Payment Hub |
Custom pricing |
Mid-sized and large global enterprises |
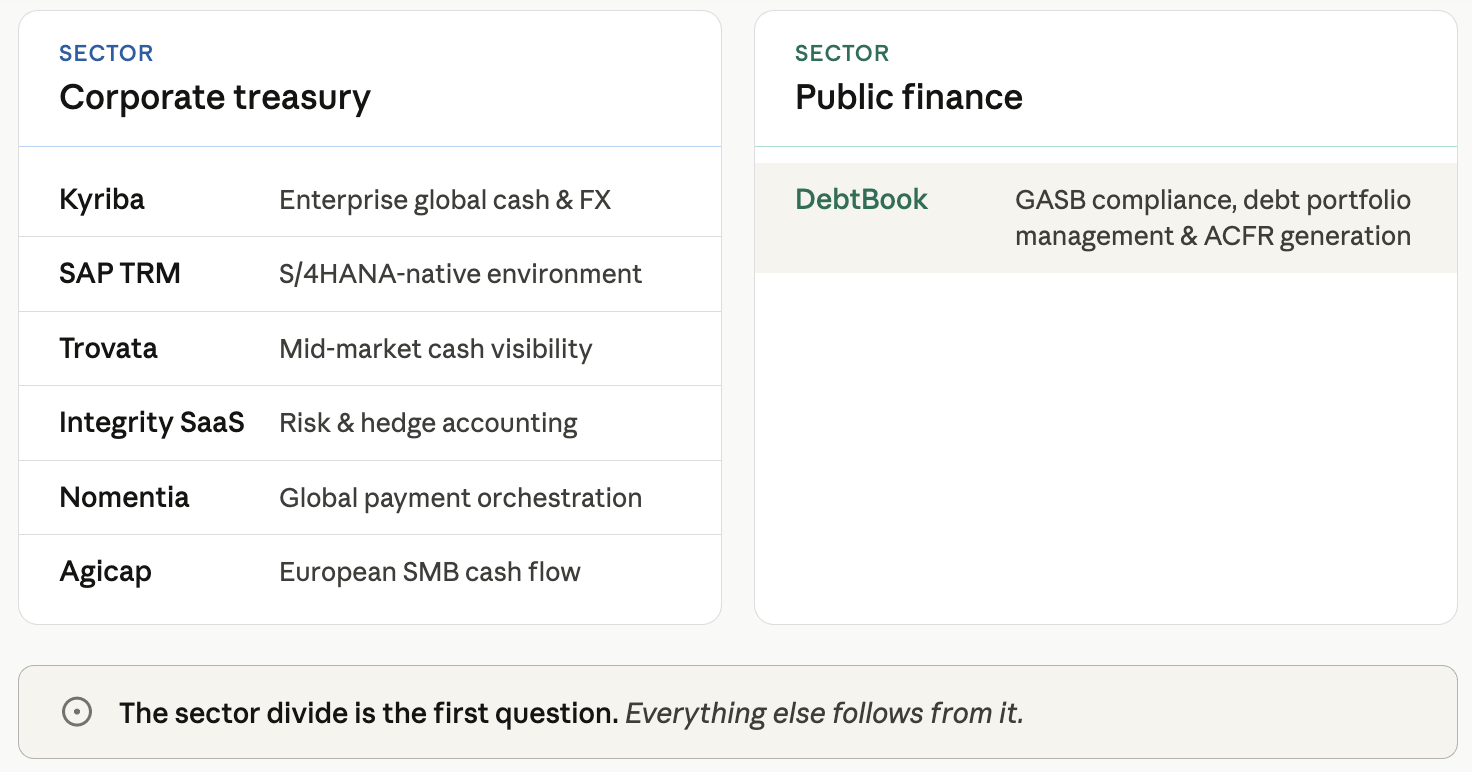
What makes the best GTreasury alternatives?
The treasury management market divides along a line that most comparison guides never name: corporate finance and public finance operate under fundamentally different compliance regimes, and the tools built for one rarely serve the other well.
For corporate treasury teams, the critical capabilities are global cash visibility, FX risk management, payment automation, and bank connectivity at scale.
For public finance organizations managing government debt portfolios, the critical capabilities are automating GASB compliance, generating ACFR footnotes, tracking bond schedules, and preserving institutional knowledge before experienced staff retire.
Four criteria separate the platforms that fit public finance from those that do not. Public sector compliance depth comes first, followed by how specifically the platform handles debt portfolio management, how much implementation burden the team absorbs, and whether the AI addresses actual workflows today.
How we reviewed these tools
To evaluate the best GTreasury alternatives, we analyzed G2 reviews, official product websites, and publicly available pricing pages for each competitor in this set.
We assessed each platform against the criteria most relevant to treasury and finance professionals in state and local government, higher education, healthcare, and the nonprofit sector: compliance workflow automation, debt portfolio management depth, implementation complexity, AI capabilities, and fit for the public finance operating environment.
For Monetary, we conducted a hands-on product review and drew on documented customer outcomes from organizations including the City of Milwaukee, the City of Durham, and the City of Memphis.
Pricing information reflects what each vendor publicly discloses; where no pricing is published, we note that a sales conversation is required. Trovata is the only platform in this set with a published starting price of $24,000 per year.
Best for public finance organizations replacing legacy debt management systems with GASB-native compliance automation
Monetary
Best For: State and local governments, higher education, healthcare, and nonprofits managing complex debt portfolios
Pricing: Contact for pricing
Trusted by: City of Milwaukee, City of Memphis, City of Durham, UNC Charlotte
Monetary is a unified public finance platform covering debt, cash, leases, subscriptions, investments, and contracts in a single system. Every module is built around the workflows, compliance standards, and reporting structures of government and nonprofit finance, which means GASB 87, GASB 96, and ACFR generation are core to the platform’s design rather than features grafted onto a corporate treasury tool.
Where platforms like Kyriba and SAP Treasury and Risk Management are optimized for global cash pools, foreign exchange hedging, and enterprise payment networks, Monetary is optimized for bond schedules, refunding lineage, GASB compliance automation, and the audit workflows that define the public finance calendar.
Who should use Monetary?
Monetary fits treasury and accounting teams at state and local governments, public universities, healthcare organizations, and nonprofits that manage significant debt portfolios and face recurring GASB compliance obligations.
If your team currently tracks bond schedules in spreadsheets, spends weeks on ACFR footnote preparation, or carries key-person risk because one person understands the debt file, Monetary addresses all three problems directly. Organizations with variable-rate debt, complex refunding histories, or multi-departmental access requirements will find the platform’s depth particularly relevant.
The City of Memphis evaluated options to improve transparency and access to debt information, including state revolving fund loans and commercial paper, with visibility beyond the debt management team. Their assessment: Monetary “was what I envisioned, but actually a little bit more.”
Standout features
- Monetary’s AI Contract Processing extracts key contact data points for GASB 87 and GASB 96 compliance, eliminating manual data entry from the compliance workflow.
- Automated Long-Term Obligation Disclosure generates ACFR audit notes, debt outstanding summaries, and detailed roll-forward tables by activity and fund in a few clicks.
- True Lineage Refunding Tracking builds a complete lineage of every bond issue, tracing refundings down to the allocation level for audit-ready documentation.
How Monetary works
Monetary’s Debt Management module functions as a single source of truth for an organization’s entire debt portfolio. Treasury teams can track bond schedules, manage allocations, monitor payment activity, and build refunding lineage that traces every bond issue down to the individual allocation.
Variable Rate Debt Management automatically generates reset rates using market data integrations and identifies interest due for each reset and payment period, removing the manual calculation burden that trips up teams managing floating-rate obligations.
New Issue Structuring with Sizing lets treasury teams build scenarios, set structure and required proceeds, input interest payment details, and compare financing options before a bond goes to market, giving finance leaders a structured analytical tool rather than a spreadsheet model.
The compliance automation layer is where Monetary separates itself most clearly from every corporate treasury tool in this comparison. Accounting teams generate full and modified accrual journal entries and GASB-compliant footnote disclosures directly from the platform.
AI Contract Processing scans lease and subscription contracts to extract key data points, including terms, payment amounts, and commencement dates, feeding the GASB 87 and GASB 96 compliance workflows without manual re-entry. The City of Durham, NC reduced debt service budget preparation from a full day to 45 minutes after moving to Monetary, and when the city experienced a malware incident, its cloud-based architecture had the team back up and running, while the previous on-premise system offered little support.
Cash Management connects to financial institutions through secure bank APIs, pulling real-time transaction data into profiles and applying custom categorization rules automatically. Projected closing balances update in real time, and teams can build 13-month cash forecasts from the same interface.
Fraud Prevention and Bank Fee Analysis flags suspicious transactions and unusual outflows, and analyzes account analysis statements to surface potential overcharges, giving cash managers a layer of oversight that previously required manual review.
The platform operates on a cloud-based, unlimited-user model, which means access extends across departments, and auditors receive their own logins to retrieve debt documents and outstanding balances directly, reducing the bottleneck that forms when one person controls the data.
How much does Monetary cost?
Monetary does not publish pricing tiers. Pricing is determined through a custom quote based on the organization’s size, module selection, and portfolio complexity. No free trial is available, but Monetary offers a custom demo to walk through the platform’s capabilities against your specific workflows.
Get a Custom Quote
FAQ
Does Monetary offer a free trial?
No free trials are available, but Monetary would love to show you around in a custom demo tailored to your organization’s use case. Get a Demo to see the platform’s debt management, compliance automation, and cash management capabilities in the context of your workflows.
How does Monetary handle GASB 87 and GASB 96 compliance?
Monetary’s Lease Management module automates GASB 87 compliance for lease agreements covering buildings, equipment, vehicles, and land. Subscription Management handles GASB 96 obligations for subscription-based information technology arrangements, including project cost tracking for implementation costs.
Both modules use AI Contract Processing to extract key data points from contracts, then generate full and modified accrual journal entries and audit-ready footnote disclosures without manual re-entry. Accounting teams that previously spent weeks on annual compliance can complete the same work in a fraction of the time.
Is Monetary built for large or complex debt portfolios?
Monetary supports large, complex debt portfolios. The City of Milwaukee reduced a multi-day Tax Increment District management process to 30 minutes after evaluating five to six alternatives. This depth matters most for teams managing variable-rate debt, intricate refunding histories, or portfolios with private business use compliance requirements.
Best for enterprise corporate treasury at global scale
Kyriba
- Best For: Enterprise corporate treasury teams managing global cash, payments, and FX risk
- Pricing: Contact Kyriba for current pricing
- Free Trial: Not listed
Kyriba is a global liquidity performance platform serving 3,000 customers worldwide, processing more than $15 trillion in payments annually across 3 billion bank transactions. That scale reflects its core audience: large and mid-market corporate organizations in finance, technology, retail, manufacturing, and insurance that need a single platform to consolidate global cash positions, automate payments, and manage foreign exchange exposure.
The platform’s connectivity spans over 9,900+ bank connections, plus ERP and treasury system integrations (including SAP and Oracle Fusion), which gives enterprise teams a realistic path to replacing fragmented portals and spreadsheets with a unified operational picture.
Where Kyriba earns its reputation is in the breadth of its treasury function coverage. Real-time cash positioning, AI-powered liquidity forecasting through its dedicated agentic AI product TAI, payments automation with bulk processing capabilities, and structured approval hierarchies with segregation of duties are all available within one platform.
G2 reviewers highlight the ability to process up to 100 payments in a single batch as a concrete workflow improvement, and the platform’s enforcement of approval workflows gives treasury teams the internal controls that enterprise finance departments require. The tradeoff is implementation complexity: users consistently note that setup is time-consuming, requires specialized knowledge, and can increase dependency on external administrators or support resources.
Who should use Kyriba?
Kyriba fits enterprise and mid-market corporate treasury teams that operate across multiple banks, currencies, and geographies and need a platform that handles the full complexity of global liquidity management.
Organizations already running SAP or Oracle Fusion will find the integration path well-documented and user-validated. Treasury teams that process high volumes of payments daily, manage FX exposure, and need real-time visibility into liquidity across entities will get the most from the platform’s depth, provided they have the internal capacity or external support to manage a configuration-intensive implementation.
Standout features
- Kyriba’s TAI agentic AI product delivers real-time cash forecasting and liquidity scenario modeling across risk exposures.
- Connectivity to over 9,900 banks, ERPs, and treasury systems provides one of the broadest integration networks available in corporate treasury software.
- Structured payment automation with bulk processing, approval workflows, and segregation of duties supports enterprise-grade internal controls.
How Kyriba works
Kyriba connects to an organization’s banking infrastructure, ERP systems, and payment networks through its integration layer, pulling transaction data into a centralized cash position that updates in real time.
Treasury teams log into a single interface rather than cycling through multiple bank portals, and the platform applies configurable categorization rules and approval hierarchies to structure how cash movements are reviewed and authorized.
The result is a consolidated operational view of global liquidity that replaces the manual aggregation work that typically consumes treasury staff hours each morning.
The platform’s AI capabilities extend that foundation into forecasting. TAI, Kyriba’s agentic AI product, models liquidity scenarios and generates cash forecasts by analyzing transaction patterns and exposure data, giving treasury teams a forward-looking view alongside the real-time position.
Payments automation handles routine disbursements through bulk processing and automated reconciliation, reducing manual entry and the error risk that comes with it. For organizations managing FX exposure, the platform monitors currency positions and supports risk management workflows alongside the core cash and payments functions.
Where implementation demands attention is in configuration. G2 reviewers describe the setup process as requiring significant time and specialized knowledge, and some workflows depend on dedicated administrators to maintain.
Organizations evaluating Kyriba should factor in the internal resource commitment or external support budget that a full deployment requires, particularly if they are migrating from a simpler or more manual treasury environment.
How much does Kyriba cost?
Kyriba does not publish pricing publicly. Contact Kyriba directly for current pricing details.
FAQ
Q: How difficult is it to implement Kyriba, and what should organizations expect during setup?
Implementation is consistently described by G2 reviewers as time-consuming and configuration-intensive. The platform’s breadth means there are many modules and workflows to configure, and some organizations report needing specialized knowledge or external support to complete the setup properly.
Treasury teams should plan for a meaningful implementation timeline and assess whether they have the internal capacity or budget for external assistance before committing. Organizations with dedicated treasury IT resources or existing relationships with SAP or Oracle implementation partners will be better positioned to manage the process.
Q: Does Kyriba support public sector compliance requirements like GASB reporting or ACFR footnote generation?
Kyriba’s documented capabilities do not include GASB compliance workflows, ACFR footnote generation, or government fund accounting structures. The platform is designed for corporate treasury use cases across commercial industries, and its compliance features reflect that focus: hedge accounting audit trails, FX risk documentation, and payment controls built for corporate finance environments.
Organizations in state and local government, higher education, healthcare, or the nonprofit sector with GASB reporting obligations should evaluate platforms built specifically for those requirements.
Best for mid-to-enterprise corporate treasury and risk management
Integrity SaaS Treasury Management
- Best For: Mid-to-enterprise organizations managing complex treasury and hedge accounting needs
- Pricing: Contact FIS for current pricing
- Free Trial: Not listed
FIS Treasury and Risk Manager, Integrity Edition positions itself as a single path from basic cash positioning to the full complexity of hedge accounting, which means it can grow alongside an organization’s treasury requirements without requiring a platform change. The system automates core treasury functions, including cash flow documentation, investment schedule management, and amortization tracking for complex and dynamic portfolios.
Its Treasury GPT feature, an in-platform large language model, lets users query the system directly about configuration and operational practices, reducing the friction that typically accompanies onboarding and ongoing administration.
Where Integrity SaaS earns its credibility is in the depth of its risk and amortization capabilities. Users report that the platform handles complicated amortization schedules for company investments that would otherwise require manual tracking, and that its transaction records provide a reliable foundation for year-end audit preparedness.
That combination of operational efficiency and audit readiness makes it a credible option for treasury teams carrying significant investment complexity. The integration story is more complicated: G2 reviewers flag that connecting Integrity SaaS to external systems is “tricky” and “very difficult,” which matters for organizations expecting smooth ERP or bank connectivity from day one.
Who should use Integrity SaaS Treasury Management?
Integrity SaaS fits mid-to-enterprise corporate organizations that need a single platform spanning basic cash positioning and sophisticated hedge accounting, particularly those managing complex investment portfolios with dynamic amortization schedules.
Treasury teams that prioritize audit-ready transaction records and want an AI assistant for in-platform guidance will find the feature set well-matched to their needs. Organizations with significant corporate risk management requirements, including FX exposure and hedge strategy documentation, are the clearest fit.
Standout features
- Treasury GPT: An in-platform large language model that responds to queries about usability, configuration, and operational practices.
- Hedge accounting support: Manages the full complexity spectrum from basic cash positioning through compliant hedge accounting strategies.
- Complex amortization tracking: Automates dynamic amortization schedules for investment portfolios that are otherwise difficult to manage manually.
How Integrity SaaS Treasury Management works
FIS built Integrity SaaS around a core premise: treasury complexity should not require multiple platforms. The system handles the full range of corporate treasury functions within a single environment, connecting ERP systems, specialized financial systems, and FIS SWIFT Services through configured integrations.
Treasury GPT sits on top of that operational layer, giving users a conversational interface for configuration questions and workflow guidance rather than routing every query through a support ticket.
The platform’s investment management capabilities are where it differentiates most clearly from lighter-weight cash visibility tools. Integrity SaaS automates the investment schedules and amortization calculations that consume significant manual hours in organizations managing complex portfolios, and it maintains a transaction-level audit trail that supports year-end audit workflows.
For organizations managing both routine cash positioning and sophisticated risk instruments, those capabilities coexist in one system rather than requiring separate point solutions.
Integration is the area requiring the most planning. Connecting Integrity SaaS to external systems, including ERPs and bank platforms, has been described by G2 reviewers as technically demanding. Organizations evaluating the platform should factor in the internal technical resources or implementation support needed to establish those connections before go-live.
How much does Integrity SaaS Treasury Management cost?
FIS does not publish pricing for Integrity SaaS Treasury Management. Contact FIS directly for current pricing based on your organization’s size and requirements. G2 reviewers note that pricing can be a barrier for smaller or lower-margin organizations, which suggests the cost structure is calibrated toward mid-market and enterprise buyers.
FAQ
Q: Does Integrity SaaS Treasury Management support hedge accounting compliance documentation?
Yes. Hedge accounting is one of Integrity SaaS’s core capabilities, and the platform is designed to handle the full complexity spectrum from basic cash positioning through hedge strategy documentation. For organizations that need to manage FX exposure, interest rate risk, and compliant hedge accounting in a single system, this is one of the stronger options in the mid-to-enterprise corporate treasury market.
Q: How difficult is it to integrate Integrity SaaS with existing ERP systems?
FIS positions ERP and SWIFT integration as a configured capability, and the platform is designed to automate data flows between ERPs, specialized systems, and bank networks. In practice, G2 reviewers describe the process of connecting Integrity SaaS to external products as “tricky and very difficult,” so organizations should plan for dedicated technical resources during implementation rather than assuming a plug-and-play experience.
Best for large enterprises running SAP S/4HANA
SAP Treasury and Risk Management
- Best For: Large enterprises already committed to the SAP S/4HANA environment
- Pricing: Contact SAP for current pricing
- Free Trial: Not listed
SAP Treasury and Risk Management is delivered as a module within SAP S/4HANA Cloud. For organizations already running SAP ERP, that architecture is a genuine strength: cash management, forecasting, and payments unify in a single system rather than requiring a separate integration layer.
The platform automates bank statement reconciliation using AI, generates cash positions from integrated data sources, and maintains full audit trails for hedge accounting strategies, giving enterprise treasury teams a unified view of liquidity and financial risk without leaving the SAP environment.
Where SAP Treasury and Risk Management earns its reputation is in financial risk management depth. The platform monitors risk positions and currency conversion rates to support compliant hedge accounting strategies, a capability that corporate treasury teams managing FX exposure and complex borrowing structures rely on. U
sers on G2 consistently describe the platform as reliable and well-optimized for operational treasury problems, particularly when the underlying SAP infrastructure is already in place. The trade-off is that this depth comes with significant setup complexity: reviewers describe initial configuration as requiring careful planning and specialized technical expertise, and some modules feel less modern than newer treasury tools built on contemporary UI frameworks.
Who should use SAP Treasury and Risk Management?
SAP Treasury and Risk Management fits large enterprise organizations already running SAP S/4HANA that need native integration between treasury operations, cash forecasting, and financial risk management.
It’s particularly well-suited to organizations with dedicated IT resources and treasury teams managing FX exposure, hedge accounting, and complex borrowing structures across multiple entities. If your organization has already committed to the SAP environment and needs treasury functionality that operates within that infrastructure rather than alongside it, this is the logical choice.
Standout features
- Native SAP S/4HANA integration unifies cash management, forecasting, and payments in one environment without a separate integration layer.
- Hedge accounting audit trail monitors risk positions and currency rates to support compliant FX risk management strategies.
How SAP Treasury and Risk Management works
SAP Treasury and Risk Management operates as an integrated module within SAP S/4HANA Cloud, so the platform’s core advantage is that treasury data lives in the same system as the broader enterprise financial record.
Cash positions are generated automatically from integrated sources, bank statement reconciliation runs through AI-assisted processing, and payments are confirmed through two-way integration with multiple trading platforms. For organizations already in the SAP environment, this architecture eliminates a category of data synchronization problems that standalone treasury tools typically require middleware to solve.
The financial risk management capabilities follow the same integrated logic. The platform monitors FX exposure and interest rate risk, supports hedge accounting strategies with structured audit trails, and enables liquidity scenario modeling alongside cash forecasting. These are capabilities built for corporate treasury teams managing complex borrowing structures and currency risk across global operations.
The implementation reality, however, deserves honest attention. G2 reviewers consistently note that configuration requires significant technical expertise and careful planning, and that some modules still require manual data aggregation despite the platform’s automation features. Organizations without dedicated SAP administrators or IT resources to support the initial build should factor that resource requirement into any timeline estimate.
How much does SAP Treasury and Risk Management cost?
SAP does not publish pricing for Treasury and Risk Management. Contact SAP directly for current pricing based on your organization’s size, existing SAP licensing, and the specific modules required.
FAQ
Q: Does SAP Treasury and Risk Management work if my organization doesn’t already use SAP S/4HANA?
SAP TRM requires an SAP ERP backbone. Organizations not on SAP S/4HANA could deploy it on SAP ECC or migrate to S/4HANA, but it is never a standalone product. A non-SAP shop would not deploy TRM in isolation. Organizations without an existing SAP environment should expect substantially higher implementation complexity and cost, since they would effectively be adopting two interconnected systems rather than extending one.
Q: How does SAP Treasury and Risk Management handle hedge accounting compliance?
The platform maintains a full audit trail for hedge accounting strategies, monitoring risk positions and currency conversion rates to support compliant FX risk management. This is one of the capabilities that enterprise treasury teams with complex FX exposure specifically seek out in SAP’s platform.
The audit trail documentation is built into the workflow rather than generated as a separate export, which supports both internal controls and external audit requirements for organizations managing significant currency risk across multiple entities.
Best for real-time corporate cash visibility without heavy IT involvement
Trovata
- Best For: Mid-market treasury teams wanting fast, modern multibank cash visibility
- Pricing: Starting at $24,000/year, billed annually
- Free Trial: Not listed on pricing page
Trovata is a modern cash management platform built to replace the daily ritual of logging into multiple bank portals and manually consolidating balances into a spreadsheet. It connects directly to banks via API and pulls transaction data continuously into a single view, so treasury teams get real-time cash positioning across entities without IT configuring or maintaining the connections.
Built on that data foundation, Trovata AI adds three capabilities: Chat handles natural language Q&A against your cash data, Insights surfaces anomalies proactively, and Agents schedule recurring automation tasks.
Where Trovata earns its reputation is in the speed of that visibility. Corporate treasury teams managing cash across multiple banks and legal entities can see consolidated positions, run ad-hoc transaction searches, and generate reports without the manual aggregation work that consumes hours in legacy environments.
The platform also executes payments natively, supporting RTP, ACH, and wire transfers through direct bank API connections rather than routing through third-party payment vendors, which matters for teams that want to consolidate cash visibility and payment execution in one place.
Who should use Trovata?
Trovata fits mid-market to enterprise corporate treasury teams whose primary challenge is multibank cash visibility and reporting. It’s particularly well-suited to lean treasury functions where IT resources are limited, since the platform is designed for setup without heavy technical involvement.
Organizations managing cash across multiple banks and entities, running frequent ad-hoc reporting, and looking to automate recurring treasury tasks through AI-driven scheduling will find Trovata’s feature set closely matched to those workflows. The published starting price of $24,000 per year also gives budget-conscious teams a concrete number to evaluate before entering a sales conversation.
Standout features
- Trovata AI delivers three production-ready capabilities: natural language cash Q&A, proactive anomaly detection, and scheduled automation agents.
- Native payments execution supports RTP, ACH, and wire transfers directly through bank APIs, eliminating reliance on third-party payment vendors.
- Multibank data aggregation connects, normalizes, and continuously refreshes bank data across institutions into a single consolidated cash position.
How Trovata works
Trovata’s architecture starts with direct bank API connections that pull transaction and balance data continuously, normalizing it across institutions so the platform always reflects current positions rather than yesterday’s export.
Once the data foundation is established, treasury teams work from a single portal instead of rotating through individual bank interfaces, with all balances and transactions searchable and reportable from one place. The setup is designed to minimize IT dependency, which shortens the path from contract to working dashboard compared to platforms that require significant technical configuration.
The AI Suite layers onto that data foundation in three distinct modes. AI Chat lets users ask questions in natural language and receive answers drawn from live transaction data. AI Insights monitors for patterns and anomalies proactively, surfacing exceptions before a user thinks to look for them.
AI Agents handle scheduled automation: recurring reports, routine data pulls, and other repeating tasks that would otherwise consume analyst time. Together, these capabilities represent a coherent AI strategy rather than a single feature bolted onto a legacy platform.
Payments execution is integrated directly rather than handled through a separate vendor. Trovata supports real-time payments, ACH, and wire transfers through the same bank API connections that power cash visibility, so teams can act on their cash position without switching platforms.
For treasury functions that currently manage visibility in one tool and payments in another, this consolidation reduces both operational complexity and the reconciliation work that comes from maintaining parallel systems.
How much does Trovata cost?
Trovata publishes its starting price, which is $24,000 per year, billed annually. The entry tier includes one bank connection, 100 accounts, one million transactions, and ten users. Enterprise pricing is available on a custom basis. Contact Trovata directly or visit their pricing page for current plan details and higher-tier options.
FAQ
Q: How difficult is Trovata to configure for a team without dedicated treasury technology resources?
Trovata is designed to reduce IT dependency, and reviewers generally describe the interface as intuitive once the platform is running. That said, the initial configuration of data streams and the transaction tagging system carries a noted learning curve, with some users describing the setup process as requiring meaningful time investment before the platform delivers its full value. Teams without a dedicated treasury analyst or someone willing to invest in that configuration phase should factor that ramp into their evaluation timeline.
Q: Does Trovata support cash flow forecasting, and how customizable are those forecasts?
Trovata includes cash flow forecasting capabilities built on its real-time bank data foundation. However, some reviewers have flagged the forecasting tools as limited in customization, noting that the current feature set doesn’t fully accommodate the range of scenarios or forecast structures they need. Teams with straightforward forecasting requirements are likely to find the functionality sufficient, while those with complex multi-entity or multi-currency forecasting needs should test those workflows specifically during a proof-of-concept evaluation.
Best for European SMB and mid-market cash flow management
Agicap
- Best For: European SMBs and mid-market companies managing multi-entity cash flow
- Pricing: Contact Agicap for current pricing
- Free Trial: Not listed on pricing page
Agicap is a European cash flow management platform serving over 8,000 clients across 12 countries, built around the operational reality of finance teams managing multiple entities, currencies, and bank accounts from a single interface. Its core strength is accessibility: the platform connects to banks and ERP systems via Open Banking APIs, automates transaction categorization using AI, and presents cash positions through visual dashboards that reviewers consistently describe as intuitive even for non-financial profiles.
Rolling 13-week cash flow planning tools let teams build and adjust forecasts quickly, and OCR-based accounts payable automation with approval workflows extends the platform’s reach into supplier invoice processing.
Where Agicap draws its clearest boundaries is in geographic and organizational scope. The platform is designed for European commercial organizations, and its feature set reflects that context: multi-currency aggregation, Open Banking API connectivity calibrated to European banking infrastructure, and AP automation workflows suited to commercial invoice processing.
Agicap’s documented capabilities do not include GASB compliance workflows, debt portfolio management, or government audit note generation. Organizations operating outside Europe or requiring public-sector accounting standards will find the platform’s architecture points in a different direction.
Who should use Agicap?
Agicap fits European SMBs and mid-market companies whose primary treasury challenge is consolidating cash visibility across multiple entities and bank accounts. Finance teams that spend significant time logging into separate banking portals, manually reconciling multi-currency positions, or routing supplier invoices through disconnected approval chains will find the platform’s Open Banking connectivity and AP automation directly address those friction points. Organizations with a lean treasury function that need forecasting and cash monitoring without a heavy implementation lift are the clearest fit.
Standout features
- AI-powered transaction categorization automatically matches bank transactions with invoices across multiple entities and currencies.
- OCR-based accounts payable automation processes supplier invoices with approval workflows and automated payment execution.
- Open Banking API connectivity aggregates and synchronizes multi-currency cash positions across banks and ERP systems in real time.
How Agicap works
Agicap connects to a company’s banks and ERP systems through Open Banking APIs, pulling transaction data automatically and normalizing it across entities and currencies into a single cash management view. AI-powered categorization applies to incoming transactions. It matches bank activity against invoices and flags items that need attention, which reduces the manual reconciliation work that consumes time in multi-entity finance teams. The platform’s visual dashboards present consolidated positions in a format designed for fast interpretation, a deliberate choice that extends usability beyond treasury specialists to broader finance and management stakeholders.
From that cash visibility foundation, Agicap extends into forecasting and payables. The rolling 13-week planning tools let teams build short- and medium-term cash projections and adjust them as conditions change, with the goal of supporting faster decisions on liquidity. The accounts payable module adds OCR-based invoice capture, approval routing, and payment execution, bringing supplier payment workflows into the same platform rather than leaving them in disconnected systems.
Reviewers note that the centralization of multiple entities into one view is where the platform delivers its most tangible value, particularly for fund managers and holding structures overseeing a range of operating companies.
How much does Agicap cost?
Agicap does not publish pricing publicly. Contact Agicap directly for current plan pricing and details.
FAQ
Q: How long does Agicap’s onboarding typically take, and what does setup involve?
Reviewers on G2 describe the initial setup as complex and time-consuming, with multiple meetings required to align the platform’s configuration to specific company needs. The process involves connecting bank accounts via Open Banking APIs, integrating with ERP systems, and establishing categorization rules and approval workflows.
Agicap’s support team receives consistent praise for responsiveness during this period, which reviewers credit with making the onboarding manageable despite its complexity. Organizations with a lean finance team should factor implementation time into their evaluation timeline.
Q: Does Agicap support multi-currency and multi-entity treasury management?
Multi-entity and multi-currency cash centralization is one of Agicap’s primary strengths. The platform connects to banks across multiple countries via Open Banking APIs, aggregates positions in different currencies, and presents consolidated views across entities in a single interface.
Reviewers managing dozens of bank accounts across varied legal structures describe this consolidation capability as the feature that most directly addresses their operational challenge. Organizations with complex European holding structures or subsidiaries operating across multiple currencies are the clearest fit for this capability.
Best for global enterprise payments and multi-bank connectivity
Nomentia
- Best For: Global enterprises centralizing cross-border payments, FX risk, and multi-bank connectivity
- Pricing: Contact Nomentia for current pricing
- Free Trial: Not listed on pricing page
Nomentia is a modern SaaS cash and treasury management platform serving over 1,400 companies across more than 80 countries. Its core strength is payment orchestration at scale: a centralized payment hub that connects ERPs, financial systems, and banks to automate local, cross-border, and global payments from a single point.
That connectivity extends to over 10,000 banks globally, with fully managed connections and file format conversions that reduce the technical burden on treasury teams handling diverse banking relationships. The platform also provides real-time cash visibility across 2,500-plus banks and applies machine learning to develop cash flow forecasts automatically.
Where Nomentia earns its strongest reviews is in FX automation and transparency. Users credit the platform with reducing the manual Excel management that typically accompanies foreign exchange exposure tracking, and the customizable payment approval workflows accommodate the complex group structures that large global enterprises operate within.
Who should use Nomentia?
Nomentia fits mid-sized to large enterprises that manage significant global payment volumes across multiple banks, currencies, and legal entities. Organizations with complex FX exposure, cross-border payment workflows, and a need to harmonize payment approvals across a large group structure will find the platform’s payment hub and risk management capabilities directly relevant. It suits treasury teams that have outgrown legacy systems and want a cloud-based alternative with broad bank connectivity and managed format conversions, without requiring the implementation footprint of a platform like SAP Treasury and Risk Management.
Standout features
- Nomentia’s payment hub centralizes local, cross-border, and global payments across ERPs, financial systems, and banks in one workflow.
- Bank connectivity spans over 10,000 institutions globally, with fully managed connections and automated file format conversions.
How Nomentia works
Nomentia’s payment hub sits at the center of the platform, pulling together connections from ERP systems and financial platforms to route payments through a single, controlled channel. Cash visibility and risk management build on that foundation. This architecture is designed to eliminate the fragmented payment workflows that emerge when large organizations manage dozens of banking relationships independently, each with its own format requirements and approval processes.
Cash visibility works through Nomentia’s bank connectivity layer, which aggregates real-time positions across a broad network of financial institutions. The platform applies machine learning to that consolidated data to generate cash flow forecasts, reducing the manual effort of pulling and reconciling bank data from multiple sources. For organizations managing cash across multiple currencies and geographies, this real-time aggregation is the operational foundation everything else builds on.
The FX and risk management module extends that visibility into exposure management, giving treasury teams a structured process for identifying key risk drivers and implementing hedging strategies. Users can track FX exposure across the portfolio and automate core hedging processes, replacing the manual spreadsheet workflows that introduce both errors and delays. Together, these three layers form a connected treasury workflow rather than a collection of standalone tools.
How much does Nomentia cost?
Nomentia does not publish pricing publicly. Contact Nomentia directly for current pricing details specific to your organization’s size, bank connections, and module requirements.
FAQ
Q: How difficult is Nomentia to configure and maintain after implementation?
Nomentia users consistently describe the initial implementation as faster and more intuitive than legacy treasury systems, and the HTML5 interface earns strong marks for day-to-day usability. That said, G2 reviewers note that parameter settings and mapping tables can become complex as configurations grow, and some users feel the platform’s guidance for those configurations is insufficient. Organizations with dedicated treasury operations staff or an implementation partner will be better positioned to manage ongoing configuration than lean teams without that internal expertise.
Q: Does Nomentia support advanced reporting and analytics out of the box?
Nomentia provides predefined report structures for standard treasury reporting needs. However, users who require advanced functionality, specifically the ability to pivot data in Excel downloads, have noted that this capability requires an additional upcharge rather than being included in the base platform. Organizations with complex, ad hoc reporting requirements should clarify exactly which reporting features are included in their specific contract before signing, to avoid discovering that the analysis workflows they rely on carry additional cost.
Why Monetary is the best GTreasury alternative for public finance organizations
If your organization adheres to GASB standards, manages a complex debt portfolio, and produces an ACFR, Monetary is the only platform in this set built for that reality from the ground up.
Get a Demo of Monetary
Click Here
Disclaimer
The information provided in this article is accurate at the time of publication in 2026. Product features, pricing, and availability are subject to change. We recommend verifying current details directly with each vendor before making a purchasing decision. Competitor information is sourced from G2 reviews, official product websites, and publicly available pricing pages.
Related Treasury Management Reading
Disclaimer: Monetary does not provide professional services or advice. Monetary has prepared these materials for general informational and educational purposes, which means we have not tailored the information to your specific circumstances. Please consult your professional advisors before taking action based on any information in these materials. Any use of this information is solely at your own risk.
Best Treasury Management Systems: We Reviewed 7 – Here’s Our Pick
Most treasury management systems can show you a cash position. The question that separates them is what happens next: whether the platform connects that position to a debt service schedule, routes it into a rolling forecast, and generates the ACFR footnotes your auditor needs, all without a spreadsheet in between.
For public finance teams, the right treasury management system is the one that scores highest across four specific criteria: public finance specificity, platform breadth, compliance workflow automation, and institutional knowledge preservation.
Every tool in this guide is evaluated against those four pillars, and the ranking that follows reflects how each platform performs on them.
TL;DR
• Choose Monetary if your organization is a state or local government, higher education institution, healthcare organization, or nonprofit that needs GASB 87 and GASB 96 compliance automation, debt portfolio management, and cash positioning in one purpose-built platform.
• Choose Kyriba if you’re a large multinational corporate managing FX risk, global liquidity, and payments across 9,900+ bank connections.
• Choose Ripple Treasury if you’re a Fortune 500 enterprise treasury team that needs AI-driven cash visibility and digital asset infrastructure deployed quickly.
• Choose Trovata if your primary need is fast, API-first multibank cash visibility at a transparent starting price of $24,000/year.
• Choose HighRadius if you’re a large B2B enterprise automating order-to-cash and accounts receivable at scale.
• Choose FIS Integrity if you’re a large corporate with complex global cash, payments, and risk management requirements.
• Choose Coupa if your focus is procurement, invoicing, and total spend management rather than treasury and debt operations.
The bottom line: Every corporate TMS on this list can show you a cash position. Only Monetary connects that cash position to your debt service schedule, generates your ACFR footnotes, and automates GASB 87 and GASB 96 compliance, without a single spreadsheet in between.
Get a Demo of Monetary Today
Click Here
What makes the best treasury management system?
Most “best TMS” guides evaluate tools through a corporate finance lens: multi-currency cash pooling, FX hedging, global payment hubs, etc.
For treasury and accounting teams at state and local governments, higher education institutions, healthcare organizations, and nonprofits, those criteria are often irrelevant.
The real questions are whether a platform automates GASB 87 and GASB 96 compliance, generates ACFR footnotes without a time consuming manual process, tracks debt refunding lineage down to the allocation level, and preserves institutional knowledge when a key person retires.
Four criteria separate the tools that actually meet buyer requirements
- Public finance specificity: Does the platform support GASB 87 and GASB 96 compliance workflows, ACFR footnote generation, variable rate debt management, and IRS private business use tracking, or does it require workarounds to approximate these functions?
- Platform breadth: Does the system unify debt management, cash positioning, lease and subscription compliance, investment management, and contract management in one place, or does it solve one problem while leaving the others to spreadsheets?
- Compliance workflow automation: Does the platform generate journal entries, audit footnotes, and filing schedules automatically, or does it store data that staff must still manually format for auditors?
- Institutional knowledge preservation: Does the system eliminate key-person risk through cloud-based access, unlimited users, and complete audit trails, so that the workflows survive when experienced staff retire?
How we reviewed these tools
We evaluated seven treasury management systems against the criteria above, drawing on official product documentation, pricing pages, and G2 and Capterra user reviews for each competitor.
Competitor strengths and limitations are sourced directly from verified user reviews and official websites.
For Monetary, we conducted a hands-on product review and analyzed documented customer outcomes across multiple public finance organizations.
We weighted public finance specificity and compliance automation most heavily, because those criteria determine whether a platform actually fits this buyer’s operational reality. Tools that excel for corporate treasury teams are evaluated on their own terms and recommended honestly for the buyers they serve.
Monetary
Best For: State and local governments, higher education institutions, healthcare organizations, and nonprofits managing debt portfolios, GASB compliance and cash positioning.
Pricing: Contact for pricing
Trusted by: City of Milwaukee, City of Memphis, Town of Granby, Vermont Bond Bank
Every module in Monetary reflects how government, higher education, healthcare, and nonprofit organizations actually operate: debt service schedules, GASB 87 and GASB 96 compliance automation, Annual Comprehensive Financial Report (ACFR) footnote generation, and variable rate debt management are core functionality, not add-ons adapted from a corporate treasury tool.
The six modules (Debt Management, Cash Management, Investment Management, Lease Management, Subscription Management, and Contract Management) operate on a single platform where data flows between functions natively, so debt service payments feed into cash forecasts without a manual export in between.
The platform was designed around a structural problem that every public finance team recognizes: institutional knowledge concentrated in one person, one spreadsheet, or one legacy system that only a specialist can navigate.
Monetary’s cloud-based architecture with unlimited users eliminates that bottleneck. When a key person retires, the data stays, the audit trail stays, and the workflows stay, accessible to every authorized team member without a license restriction or a specialized training requirement.
Who should use Monetary?
Treasury managers, debt managers, cash managers, finance directors, and comptrollers at state and local governments, higher education institutions, healthcare organizations, and nonprofits should evaluate Monetary. It fits organizations that manage a debt portfolio alongside lease compliance and cash positioning, particularly those currently working in spreadsheets or a legacy system that requires specialized knowledge to navigate.
Standout features
- AI Contract Processing scans lease contracts for lease terms, payment amounts, and commencement dates, and scans subscription contracts for subscription terms, payment schedules, and implementation costs, surfacing suggested inputs for user review before any data is committed.
- Automated Long-Term Obligation Disclosure generates ACFR audit notes in a handful of clicks and exports formatted Excel roll-forward tables, reducing what once took days to a short task.
- Variable Rate Debt Management auto-generates reset rates through market data integrations, benchmarks against SIFMA and SOFR, and identifies interest due (including liquidity and remarketing fees) for each reset and payment period.
How Monetary works
Monetary’s primary differentiator is the depth of integration across functions that public finance teams actually use together. Debt service schedules connect to cash flow forecasts. Lease and subscription compliance workflows feed into journal entry generation on both modified and full accrual bases. ACFR footnotes pull from live portfolio data rather than a manually assembled spreadsheet.
The City of Memphis centralized $2B in outstanding debt, including state revolving fund loans and commercial paper, into a single cloud-based source of truth after years of searching for a solution transparent enough to give access beyond the debt management team alone.
The debt management module covers the full lifecycle of a bond issue.
New Issue Structuring lets treasury teams build multiple financing scenarios before going to market, comparing required proceeds, coupon rates, and expenses side by side.
True Lineage Refunding Tracking follows each refunding down to the allocation level, showing which original issues were retired and what replaced them.
Bond Proceeds Management centralizes project-related spending data across one or more bond series.
For organizations subject to IRS scrutiny, the Private Business Use tracking hub manages project information and tracks private use by time, revenue, space, or other units to support tax compliance.
Financial Reporting standardizes recurring reports and manages continuing disclosure agreements in a central repository, with AI-assisted setup and auto-generated filing schedules that reduce the manual coordination burden.
Cash Management operates through secure API connections to financial institutions, pulling real-time transaction data throughout the day and updating projected closing balances on a continuous basis. Rule-based fraud detection flags suspicious transactions automatically, such as individual outflows above a specified threshold or check outflows from receivables-only accounts, reducing fiduciary risks.
Bank Fee Analysis surfaces discrepancies between contracted and charged prices by uploading account analysis statements, a capability that rarely appears in corporate treasury tools and reflects Monetary’s focus on the specific operational realities of public finance.
The City of Milwaukee reduced a multi-day manual debt allocation process across 117 tax increment districts to 30 minutes, replacing a legacy system that required specialized knowledge to navigate and that concentrated institutional risk in a small number of staff.
FAQ
Q: Does Monetary offer a free trial?
No free trials are available, but Monetary offers a custom demo tailored to your organization’s workflows and data. For public finance teams evaluating a platform for the first time, a configured demo is more useful than a generic trial environment because it shows how the system handles your specific debt types, compliance requirements, and reporting needs.
Q: Is Monetary built for small governments and nonprofits, or only large organizations?
Both. The platform scales from small towns to large cities managing multi-billion-dollar portfolios.
Q: How does Monetary handle GASB 87 and GASB 96 compliance?
Monetary’s Lease Management module is purpose-built for GASB 87 (government lease accounting) and its Subscription Management module addresses GASB 96 (subscription-based information technology arrangements, or SBITAs).
Both automate compliance workflows including journal entry generation, audit footnote exports, and modification tracking. Organizations that previously spent weeks on annual compliance reporting can complete the same work in a handful of clicks with Monetary.
Ripple Treasury (powered by GTreasury)
- Best For: Enterprise corporate treasuries managing global cash across multiple entities and currencies.
- Pricing: Custom pricing, contact Ripple Treasury for current pricing
- Free Trial: Not listed on pricing page
Ripple Treasury, powered by GTreasury, is an enterprise treasury management system that combines cash visibility, payments, risk management, and AI-driven analytics in a single platform. The company serves over 1,000 customers across 160 countries, positioning itself at the mid-market to Fortune 500 range, from organizations implementing their first TMS to multinationals managing complex global operations.
Its acquisition by Ripple added native digital asset infrastructure, making it one of the few TMS platforms that can consolidate fiat and digital liquidity in one view without requiring a separate custody platform.
The platform’s core value proposition is speed and connectivity: cash visibility deployable in 90 days, extensive bank and ERP integrations, and GSmart AI that surfaces anomalies and produces executive-ready analysis across core treasury workflows.
For corporate treasury teams managing multi-entity cash positions, FX exposure, and global payments, Ripple Treasury covers the essential workflows in one system. Its documented capabilities do not include GASB 87 or GASB 96 compliance automation, ACFR footnote generation, or public finance debt management workflows.
Who should use Ripple Treasury?
Ripple Treasury suits corporate treasury teams at mid-market to large enterprises that need fast, centralized cash visibility across multiple banks, entities, and currencies. Organizations that have outgrown spreadsheet-based cash positioning and need a platform with strong ERP connectivity, payments orchestration, and AI-assisted forecasting will find it well-matched to their requirements.
It’s particularly relevant for teams that manage or anticipate managing digital assets alongside traditional fiat liquidity, since that capability is built into the platform rather than bolted on.
Standout features
- GSmart AI surfaces hidden insights and detects anomalies across core treasury workflows, producing executive-ready analysis to improve forecast accuracy.
- Native digital asset infrastructure delivers a single real-time view of fiat and digital liquidity held across bank and custody providers, eliminating separate platforms.
- Cash visibility deployment is structured for a 90-day go-live, with broad connectivity across banks and ERPs to build an orchestrated data environment.
How Ripple Treasury works
Ripple Treasury is built around a centralized data environment that pulls cash positions, transactions, and financial instrument data from banks and ERPs through direct integrations. Once connected, the platform updates cash positions throughout the day, allowing treasury teams to see consolidated balances across all entities without logging into individual bank portals.
GSmart AI runs continuously across this data, flagging anomalies and generating analysis that treasury managers can surface to senior leadership without additional manual preparation.
The platform organizes treasury work across several interconnected function areas:
- Cash visibility and forecasting: Real-time position management across all accounts and entities, with short and long-term forecasting that incorporates payments from financial instruments
- Payments and connectivity: Centralized payment execution with bank and ERP orchestration across the organization’s full financial infrastructure
- Digital asset management: Unified fiat and digital liquidity view across bank and custody providers, removing the need for a separate digital asset platform
- AI-assisted analysis: GSmart AI detects anomalies, surfaces insights, and generates analysis across core treasury workflows
Ripple Treasury’s connectivity model is designed for organizations with complex multi-bank, multi-entity structures. Implementations are described as running in weeks for connectivity setup, with full cash visibility targeted at 90 days.
Users cite the centralization of operations across multiple institutions as the platform’s most practical day-to-day strength, though some note that the reporting module and error resolution workflows require more manual effort than the rest of the platform suggests.
FAQ
Q: How long does it take to implement Ripple Treasury and see cash visibility?
Ripple Treasury markets a 90-day deployment timeline for cash visibility, with connectivity setup described as running in weeks. This is a marketing claim from the official website rather than a figure drawn from independent user validation, so actual timelines will vary based on the number of bank connections, ERP integrations, and entities involved. Organizations with complex multi-entity structures should plan for a scoping conversation before committing to any specific timeline.
Q: Does Ripple Treasury’s reporting module meet the needs of teams with complex reporting requirements?
User reviews on G2 consistently flag the report writer as one of the platform’s weaker areas, describing it as lacking ease of use and unintuitive for users who are new to the system. Teams with straightforward reporting needs are unlikely to find this a significant barrier, but organizations that require highly customized or ad hoc reports should evaluate the reporting module directly during a demo before committing.
Some users also note that templates for updating large data sets are difficult to navigate, which can add friction to workflows that depend on bulk data management.
Kyriba
- Best For: Enterprise finance teams managing global liquidity, FX risk, and payments across multiple entities.
- Pricing: Contact Kyriba for current pricing
- Free Trial: Not listed on pricing page
Kyriba is a global liquidity performance platform serving 3,000 customers worldwide, built for CFOs and treasurers who need to unify treasury, risk, payments, connectivity, and working capital on a single interface.
Its connectivity to over 9,900 banks, as well as ERPs, and payment systems, is one of the most extensive in the category, giving multinational organizations the ability to consolidate liquidity data across banks and countries automatically rather than through manual feeds.
The platform’s TAI, Kyriba’s agentic AI layer adds real-time cash, liquidity, and exposure forecasting across risk scenarios, which serves organizations managing complex FX positions and multi-currency cash pools.
Kyriba’s strongest differentiator is the depth of its corporate treasury automation: bulk ACH processing, automated general ledger booking, wire generation, and ERP integration with SAP and Oracle Cloud.
Reviewers on G2 consistently cite the ability to manage daily liquidity management and payment execution from a single interface as a genuine improvement over logging into multiple bank portals. The platform’s configuration demands are significant. Users report that setup is long and complex, requiring substantial support before the system is fully operational, and that some configurations require specialized knowledge to maintain over time.
Who should use Kyriba?
Kyriba fits large enterprises with complex, multi-entity treasury operations: organizations managing FX exposure, cross-border payments, and liquidity across dozens of banking relationships simultaneously.
Finance teams at midsize-to-enterprise companies in technology, manufacturing, retail, and financial services will find the platform’s bank connectivity breadth and risk management depth well matched to their operational scope. Organizations that already run SAP or Oracle Cloud will benefit most from Kyriba’s ERP integration, which automates journal entry posting and bank reporting in ways that reduce manual reconciliation at scale.
Standout features
- TAI, Kyriba’s agentic AI forecasts real-time cash, liquidity, and FX exposures across multiple risk scenarios simultaneously.
- 9,900+ bank connections automatically unify liquidity data across global banking relationships and financial systems.
- Automated payments processing handles bulk ACH uploads, GL booking, and wire generation from a single treasury interface.
How Kyriba works
Kyriba connects to an organization’s banking and ERP infrastructure through its connectivity layer, pulling transaction data and balance information from over 9,900 institutions to build a consolidated cash position.
From that unified data foundation, the platform runs treasury, risk, and payments workflows in a single interface: cash positioning, FX exposure management, payment execution, and working capital analytics all draw from the same consolidated database rather than separate siloed systems.
The TAI Agentic AI layer operates on top of that data, generating forecasts and surfacing exposure scenarios that inform liquidity decisions. For organizations with complex FX risk or multi-entity cash structures, this means treasury teams can model scenarios and stress-test positions without exporting data into external tools.
The ERP integration with SAP and Oracle Cloud closes the loop by posting journal entries and bank reconciliations automatically, reducing the manual handoff between treasury and accounting.
Kyriba’s documented capabilities do not include GASB 87 or GASB 96 compliance workflows, ACFR footnote generation, or public finance debt management features such as bond refunding lineage tracking or variable rate reset automation.
FAQ
Q: How long does Kyriba implementation typically take?
Kyriba’s implementation timeline varies by organizational complexity, but G2 reviewers consistently describe the setup process as long and configuration-intensive, requiring significant support before the platform is fully operational.
Organizations with complex multi-entity structures or extensive ERP integration requirements should plan for a substantial implementation phase and budget for configuration support, particularly if internal IT resources are limited.
Q: Does Kyriba support FX risk management alongside cash management?
Yes. Kyriba’s risk management module covers FX exposure, debt, investments, and interest rate risk within the same platform as cash and payments. This is one of Kyriba’s core differentiators for multinational organizations: treasury teams can manage currency exposure and execute hedging workflows without switching to a separate risk system. The TAI Agentic AI layer extends this by modeling exposures across multiple risk scenarios in real time.
Trovata
- Best For: Mid-market finance teams needing fast, transparent-priced multibank cash visibility.
- Pricing: Starting at $24,000/year
- Free Trial: Not listed on pricing page
Trovata is an AI-powered bank connectivity platform that replaces legacy bank portals and disconnected treasury management systems by pulling real-time financial data from hundreds of banks through open banking APIs and direct SWIFT connectivity.
Where many treasury platforms require months of configuration before delivering usable cash visibility, Trovata centers its value proposition on speed to insight: connect your banks, tag your transactions, and start seeing your global cash position without the implementation overhead that characterizes enterprise TMS deployments. The Base Package starts at a published $24,000 per year, which is notable in a category where most vendors require a sales conversation before revealing any pricing at all.
The platform’s AI capabilities, marketed as Trovata AI (Chat, Insights, and Agents), automate recurring workflows including variance analysis and daily cash reporting. Reviewers on G2 consistently highlight the quality of dynamic, customizable reporting for complex needs like global payroll reconciliation and multi-entity cash forecasting.
Customer support and onboarding also earn strong marks, with dedicated account managers cited as a differentiator during complex setups. Trovata’s documented capabilities do not include debt management, lease compliance, GASB 87 or GASB 96 workflows, or ACFR footnote generation.
Who should use Trovata?
Trovata fits mid-market corporate treasury and finance teams whose primary pain point is fragmented bank data: too many portals, too much manual spreadsheet consolidation, and not enough real-time visibility into global cash positions.
Organizations that need a fast, API-first path to consolidated cash reporting, with transparent pricing and strong onboarding support, will find Trovata well-suited to that scope. It is particularly strong for teams that need customizable reporting across multiple entities and currencies and want AI-assisted automation of daily cash workflows without a lengthy enterprise implementation.
Standout features
- Multibank connectivity via open banking APIs and direct SWIFT delivers real-time cash visibility across hundreds of global bank accounts.
- Trovata AI (Chat, Insights, and Agents) automates recurring treasury workflows including variance analysis and daily cash reporting directly within the platform.
- Developer Portal and API Platform deliver standardized bank data at scale for organizations that want to integrate financial data into their own analytics or internal tools.
How Trovata works
Trovata connects to banks through open banking APIs and, where required, direct SWIFT connectivity, pulling transaction and balance data in real time without requiring manual file uploads or portal logins.
Once connected, users build a tagging structure to categorize transactions by entity, purpose, or business unit, which then powers the platform’s reporting, forecasting, and AI-driven analysis. Reviewers note that investing time upfront in tagging architecture pays off significantly in reporting quality downstream, though the planning requirement is a real implementation consideration.
From that connected data layer, Trovata surfaces cash positions, builds short and long-term forecasts from historical data and projected activity, and automates recurring reporting tasks through Trovata AI. The platform’s capabilities span:
- Cash positioning: Real-time consolidated view across all connected accounts and entities
- Cash flow forecasting: Short and long-term forecasts built from historical transactions and ERP inputs
- Variance analysis: AI-automated comparison of actual versus forecast cash flows
- Account fee analysis: Surfacing discrepancies in bank fees (available in the Trovata TMS tier)
- Global payments automation: Available in the Trovata TMS tier for organizations managing cross-border payment workflows
For organizations that want to embed bank connectivity into their own products, Trovata also offers a developer portal with standardized API access, which positions it as both a direct-use treasury tool and a data infrastructure layer for fintechs and banks building financial applications.
| Plan |
Price |
Key Inclusions |
Limits |
| Base Package |
$24,000/year |
Balances, transactions, transaction tags, analysis, reports, forecasts, cash positioning, reconciliation, payments, entity management, Trovata AI, workbooks, statements, developer portal, investments, NetSuite and FloQast integrations, standard support
|
1 bank connection, 100 accounts, 1,000,000 transactions, 10 users |
| Trovata TMS |
Contact sales |
Capital markets (through Trovata’s ATOM acquisition), account management and fee analysis, intercompany and in-house banking, global payments automation, full treasury sub-ledger, interest rate and FX hedging derivatives |
No explicit restrictions listed |
The Base Package’s published limits (1 bank connection, 100 accounts, 10 users) are worth evaluating carefully against your organization’s actual scope before assuming the entry tier covers your full operation.
Visit Trovata’s pricing page for current details.
FAQ
Q: How much upfront planning does Trovata’s implementation actually require?
Trovata’s onboarding is generally well-regarded, with dedicated account managers helping teams through setup. The meaningful planning investment is in tagging structure: how you categorize transactions by entity, cost center, or business unit determines the quality of every report and forecast the platform generates afterward.
G2 reviewers note that teams who invest time in this architecture upfront get significantly more value from the platform’s reporting and AI capabilities. For organizations with straightforward bank structures, this is manageable. For those with complex multi-entity or multi-currency operations, it warrants a detailed scoping conversation with Trovata’s implementation team before signing.
Q: Does Trovata’s Base Package cover most mid-market treasury teams, or do most buyers end up needing the TMS tier?
The Base Package’s limits (1 bank connection, 100 accounts, 10 users) are designed for smaller or less complex operations. Mid-market teams managing multiple banking relationships, more than 100 accounts, or needing capabilities like intercompany banking, FX hedging, or global payments automation will likely require the Trovata TMS tier, which carries custom pricing.
The Base Package is a genuine entry point for organizations with contained bank footprints, but buyers with broader treasury complexity should contact Trovata directly to understand where their requirements land across the two tiers.
HighRadius
- Best For: Enterprise B2B companies automating order-to-cash, AP, and treasury workflows.
- Pricing: Contact sales for current pricing
- Free Trial: Not listed
HighRadius serves 1,300+ customers and positions itself as an agentic AI platform designed to automate the full CFO tech stack: Order to Cash, Accounts Payable, B2B Payments, Treasury & Risk, Close & Reconciliation, and Consolidation & Reporting.
The platform’s 180+ AI agents each tie to measurable KPIs, orchestrating end-to-end processes rather than assisting with individual tasks. FreedaGPT and LiveCube extend that automation further, letting finance teams build workflows through plain-language conversations rather than configuration menus.
The treasury module covers cash management, cash flow forecasting, and treasury payments, and integrates with SAP, Microsoft Dynamics, Sage Intacct, NetSuite, and Oracle.
Treasury-specific feedback is thinner than the platform’s AR and O2C reviews, but one user on Reddit described HighRadius cash forecasting as making life “a whole lot easier,” and a Konica Minolta case study published by HighRadius describes forecasting time reduced from hours of manual work to minutes.
The platform’s strength is breadth: organizations that need AR automation, AP automation, and treasury visibility under one roof will find more coverage here than in any single-function tool.
Who should use HighRadius?
HighRadius suits large B2B enterprises, particularly Global 2000 organizations in CPG, manufacturing, chemicals, energy, and technology, that need to automate high-volume receivables, payables, and treasury operations in one platform.
It performs best when an organization has the IT resources and project management capacity to handle a complex implementation and wants AI-driven automation spanning the entire finance function. Organizations with mature ERP environments running SAP, NetSuite, or Oracle will find the integration story most compelling.
Standout features
- Agentic AI Platform: 180+ AI agents orchestrate end-to-end finance processes across O2C, AP, treasury, and record-to-report, each tied to measurable KPIs.
- FreedaGPT and LiveCube: A generative AI assistant and no-code environment that converts plain-language queries into finance automation workflows without technical configuration.
- ERP Integration: Pre-built connectors for SAP, NetSuite, and Oracle Fusion enable automated journal entry posting and flexible workflow configuration across enterprise environments.
How HighRadius works
HighRadius organizes its platform around six pillars spanning Order-to-Cash, Accounts Payable, B2B Payments, Treasury & Risk, Close & Reconciliation, and Consolidation & Reporting. Within each pillar, AI agents handle discrete tasks that span the workflow, from credit decisioning to payment processing and forecasting in treasury.
The agents operate continuously, flagging exceptions and escalating edge cases rather than requiring manual triggers. FreedaGPT sits across all six pillars, giving finance teams a conversational interface for building reports, querying data, and configuring workflows without writing code.
The treasury module connects to ERPs for real-time cash positioning and forecasting, and the platform’s bank connectivity supports payment processing and reconciliation. Implementation follows a professional-services model: HighRadius assigns a project team to configure the platform to the organization’s ERP environment, workflow rules, and data structures. That configuration depth is what enables the AI agents to operate with high accuracy, but it also means the platform requires substantial upfront investment before it delivers full value.
For organizations evaluating HighRadius specifically for treasury, the platform’s primary identity is an O2C and AP automation engine, with treasury as one module within a broader enterprise suite. Teams whose primary need is cash visibility and debt management will find the treasury module functional but not purpose-built for that scope.
FAQ
Q: How long does a HighRadius implementation typically take, and what internal resources does it require?
Implementation is resource-intensive by design. Reviewers consistently recommend having a qualified project manager dedicated to the rollout, and some organizations have needed dedicated IT support throughout configuration.
The professional-services model means HighRadius assigns a team to manage setup, but the organization must be prepared to invest significant internal time on data mapping, workflow rule definition, and ERP alignment before the platform reaches full functionality. Budget for professional-services costs alongside the license fee when building your business case.
Q: Is HighRadius a good fit if treasury is my primary need rather than AR or AP automation?
HighRadius’s treasury module covers cash management, forecasting, and payments, and users report meaningful improvements in forecasting speed. However, the platform’s design center is Order-to-Cash and Accounts Payable automation: the deepest AI capabilities, the largest review volume, and the most mature feature sets all sit in those pillars.
Organizations whose primary requirement is treasury management, particularly debt portfolio management or compliance-driven cash workflows, will find the treasury module is one component of a broader enterprise suite rather than the platform’s core focus.
FIS Integrity
- Best For: Enterprise corporate treasury teams managing complex cash, payments, and risk globally.
- Pricing: Contact FIS for current pricing
- Free Trial: Not listed
FIS Treasury and Risk Manager – Integrity Edition is an enterprise treasury management system built for organizations with demanding, multi-entity treasury operations. It covers cash positioning and forecasting, centralized debt management, high-volume payments processing, foreign exchange, and investment management on a single platform, with ERP and bank connectivity via FIS SWIFT Services.
The platform also includes Treasury GPT, an LLM that responds to queries about usability, configuration, and operational practices.
G2 reviewers credit Integrity with organizing cash flow documentation and reducing the manual hours previously required for investment and amortization schedules.
Who should use FIS Integrity?
FIS Integrity suits mid-market to large enterprise corporate treasury teams managing complex, multi-entity operations across global cash, payments, and risk functions. Organizations that process high volumes of electronic payments and need a single system for FX, debt, and investment management will find the platform’s breadth well-matched to their requirements. It is a strong fit for treasury teams that already have the internal resources and budget to support a sophisticated enterprise implementation.
Standout features
- Cash Positioning and Forecasting: Centralizes cash positioning, forecasting, and debt management for complex multi-entity treasury requirements.
- Payments Processing and Fraud Mitigation: High-volume electronic payments with flexible approval rules, sanction screening, and real-time fraud alerts.
- AI-Based Treasury GPT: A large language model that answers queries on platform usability, configuration, and operational practices in natural language.
How FIS Integrity works
FIS Integrity functions as a centralized hub for enterprise treasury operations, connecting to ERPs, specialized systems, and banks through FIS SWIFT Services to pull transaction and balance data into a unified environment. From that foundation, treasury teams manage cash positioning, run forecasts, execute and approve payments, and track debt and investment portfolios without switching between systems.
The payments module is particularly built for high-volume, high-stakes environments: approval workflows are configurable, every transaction generates an automated audit trail, and sanction screening runs in real time. The AI-Based Treasury GPT layer sits across these functions, allowing users to ask operational questions about configuration and system behavior in plain language rather than navigating documentation.
| Capability |
Detail |
| Cash Positioning and Forecasting |
Centralized across entities; streamlines key department functions |
| Payments Processing |
High-volume electronic payments with flexible approval rules |
| Fraud Mitigation |
Real-time alerts and sanction screening |
| Debt and Investment Management |
Covers complex requirements alongside cash operations |
| ERP and Bank Connectivity |
Integrates via FIS SWIFT Services and direct ERP connections |
| AI-Based Treasury GPT |
Natural language queries on usability, configuration, and operations |
FAQ
Q: How difficult is it to integrate FIS Integrity with existing ERP and banking systems?
G2 reviewers flag integration with other products and internal systems as one of the platform’s more challenging aspects, describing the process as tricky and difficult to execute. FIS Integrity does offer documented connectivity via FIS SWIFT Services and ERP integrations, but organizations with complex or non-standard system environments should plan for integration effort during implementation and factor in technical resources accordingly.
Q: Is FIS Integrity a practical choice for smaller treasury teams or organizations with tighter budgets?
G2 reviewers note that the cost of FIS Integrity may be prohibitive for smaller organizations or those operating with lower profit margins. The platform is designed for mid-market to large enterprise corporate treasury operations, and its pricing and implementation complexity reflect that positioning. Smaller organizations or those with more focused treasury needs may find the investment difficult to justify relative to the scope of functionality they would actually use.
Coupa
- Best For: Enterprise organizations automating procurement, invoicing, and total spend management.
- Pricing: Contact Coupa for current pricing
- Free Trial: Not listed on pricing page
Coupa is an AI-native spend management platform serving more than 3,200 customers worldwide. Its core strength is the source-to-pay workflow: purchasing, invoicing, supplier management, and expense processing unified on a single platform, with agentic AI applied across what Coupa describes as nearly $9 trillion in spend data.
For procurement and finance teams managing high-volume indirect spend, that combination of automation depth and data scale is useful.
The platform’s scope is procurement and supply chain, not treasury. Coupa’s documented capabilities cover sourcing, contract management, procure-to-pay automation, and supply chain design. Debt portfolio management and public-sector compliance accounting workflows such as GASB 87 or ACFR footnote generation are outside Coupa’s documented focus.
Organizations evaluating Coupa for treasury management purposes will find a capable procurement platform that operates in a different functional lane.
Who should use Coupa?
Coupa fits mid-market to large enterprise organizations whose primary pain is procurement complexity: managing supplier relationships, controlling indirect spend, automating purchase orders and invoice matching, and maintaining consistent spend visibility across departments.
It works well for companies where the finance team’s biggest operational challenge is procurement governance rather than treasury operations. Organizations in manufacturing, retail, and technology that need supply chain design and optimization alongside procure-to-pay automation are the buyers Coupa is built to serve.
Standout features
- AI-Native Spend Management: Agentic AI applied across nearly $9 trillion in spend data drives sourcing decisions and supplier intelligence at scale.
- Procure-to-Pay Automation: End-to-end purchasing, invoicing, and payment processing on a single platform, including three-way matching and bulk order handling.
- Supply Chain Design and Planning: Network optimization, transportation optimization, inventory optimization, and demand modeling for direct materials and logistics.
How Coupa works
Coupa operates as a unified source-to-pay system, connecting the full procurement lifecycle from initial sourcing through supplier payment. Users access a central interface for creating purchase orders, managing approvals, processing invoices, and tracking spend against budget.
The platform’s AI layer draws on its broad spend dataset to surface recommendations across category strategy, supplier selection, and contract terms.
The workflow covers several distinct functional areas:
- Sourcing and contracting: Category strategy, advanced sourcing optimization, and contract management for supplier relationships and commitments
- Procure-to-pay: Purchase requisitions, order creation, three-way invoice matching, and payment processing
- Expense management: Mobile receipt capture, automated approval routing, and expense reporting
- Supply chain planning: Network and transportation optimization, inventory modeling, and demand forecasting
- Spend analytics: Recurring report scheduling and spend visibility across departments and entities
ERP integration connects Coupa’s procurement data to financial systems, and the supplier-facing portal handles vendor onboarding and transaction processing. Reviewers note that the supplier portal experience can be difficult to navigate, which occasionally introduces friction in the transaction cycle.
FAQ
Q: Does Coupa handle treasury functions like cash positioning or debt management?
Coupa’s documented capabilities are focused on procurement, spend management, and supply chain operations. Cash positioning at treasury-system depth, debt portfolio tracking, and compliance accounting such as GASB 87 or ACFR footnote generation are not part of Coupa’s offering. Organizations that need treasury management alongside procurement should evaluate those functions through a separate platform.
Q: How complex is Coupa’s implementation for a mid-market organization?
Coupa is an enterprise-grade platform, and implementation complexity scales with the number of modules and the depth of ERP integration required. Reviewers note that certain features, including PO approval workflows and report customization, can feel rigid once configured.
Organizations with straightforward procurement needs may find the platform more capable than their immediate requirements demand, while those with complex multi-entity procurement operations are more likely to use the platform’s full depth.
Why Monetary is the best treasury management system for public finance
Every other platform on this list was designed for corporate treasury teams managing FX exposure, intercompany netting, or global payment hubs. That’s a fundamentally different set of problems from what a debt manager at a city government or a controller at a regional healthcare system faces every day.
The capability gap that no competitor fills is the combination of debt portfolio management, GASB compliance automation, and cash positioning in a single system built around public finance workflows from the start, not adapted to them after the fact.
If your organization has complex reporting needs that require ad hoc report generation or granular fund-level payment breakdowns, Monetary’s current reporting flexibility is worth evaluating carefully in a demo.
For organizations whose primary challenge is eliminating the operational grind of manual debt tracking, audit prep, and GASB compliance, the platform’s depth in those areas is unmatched in this comparison.
Get a Demo of Monetary
Click Here
Disclaimer
The information provided in this article is accurate at the time of publication in 2026. Pricing, features, and product capabilities are subject to change. Competitor information is sourced from official websites, pricing pages, and verified user reviews on G2 and Capterra. Monetary capabilities are based on hands-on product review and official product documentation. Readers should conduct their own evaluation before making a purchasing decision.
Related Treasury Management Reading
Disclaimer: Monetary does not provide professional services or advice. Monetary has prepared these materials for general informational and educational purposes, which means we have not tailored the information to your specific circumstances. Please consult your professional advisors before taking action based on any information in these materials. Any use of this information is solely at your own risk.

